


Gold price extends losing spell amid upbeat US Dollar ahead of FOMC Minutes
- Gold price drops further as fading Fed 50 bps rate cut bets strengthened the US Dollar’s appeal.
- The downside in Gold price is expected to be limited due to geopolitical tensions.
- Investors await the FOMC Minutes and the US inflation data for September.
Gold price (XAU/USD) extends its losing streak for the sixth consecutive trading day on Wednesday. The precious metal has been battered by the upbeat US Dollar (USD), which has strengthened as traders are pricing out another Federal Reserve (Fed) larger-than-usual interest rate cut of 50 basis points (bps) in their next meeting in November.
The US Dollar Index (DXY), which tracks the Greenback’s value against six major currencies, has extended its upside to near 102.70. An appreciation in the US Dollar makes investment in the Gold price an expensive bet for investors.
Meanwhile, 10-year US Treasury yields drop to near 4.02% in Wednesday’s European session but is close to a more than two-month high. Higher yields on interest-bearing assets increase the opportunity cost of holding an investment in non-yielding assets, such as Gold.
Traders have priced out Fed large rate cut bets as upbeat United States (US) Nonfarm Payrolls (NFP) data for September reduced the risk of an economic slowdown. The US job report showed that labor demand remained robust, the Unemployment Rate decelerated, and wage growth was stronger than expected.
However, the downside in Gold price is expected to remain limited due to escalating tensions in the Middle East region. The war between Israel and Iran-backed-Hezbollah intensified after the former killed Hezbollah leader Hassan Nasrallah and his subsequent replacements. Historically, the appeal of precious metals, such as Gold, improved amid geopolitical woes.
Daily digest market movers: Gold price drops as US Dollar extends upside
- Gold price is expected to remain on tenterhooks with investors focusing on the Federal Open Market Committee (FOMC) Minutes of the September meeting, which will be published at 18:00 GMT. The FOMC Minutes will provide a detailed explanation behind the hefty rate cut and fresh cues about inflation and the economic outlook.
- In September’s meeting, the Federal Reserve started the policy-easing cycle after maintaining a restrictive policy stance for more than two and a half years. Fed officials almost unanimously (with only Michelle Bowman dissenting) voted for a sizable rate cut of 50 bps as they were more concerned about reviving job growth, with confidence that inflation is on track to return sustainably to the bank’s target of 2%.
- This week, investors will pay close attention to the US Consumer Price Index (CPI) data for September, which will be released on Thursday. Economists estimate the annual core CPI – which excludes volatile food and energy prices – to have grown steadily by 3.2%. Annual headline CPI is expected to have decelerated further to 2.3% from 2.5% in August.
- The inflation data will significantly influence market expectations for the Fed’s interest rate outlook for the remainder of the year. According to the CME FedWatch tool, 30-day Federal Fund Futures pricing data shows that there will be a 25-bps interest rate cut in each of the two meetings remaining this year.
Technical Analysis: Gold price falls to near $2,610
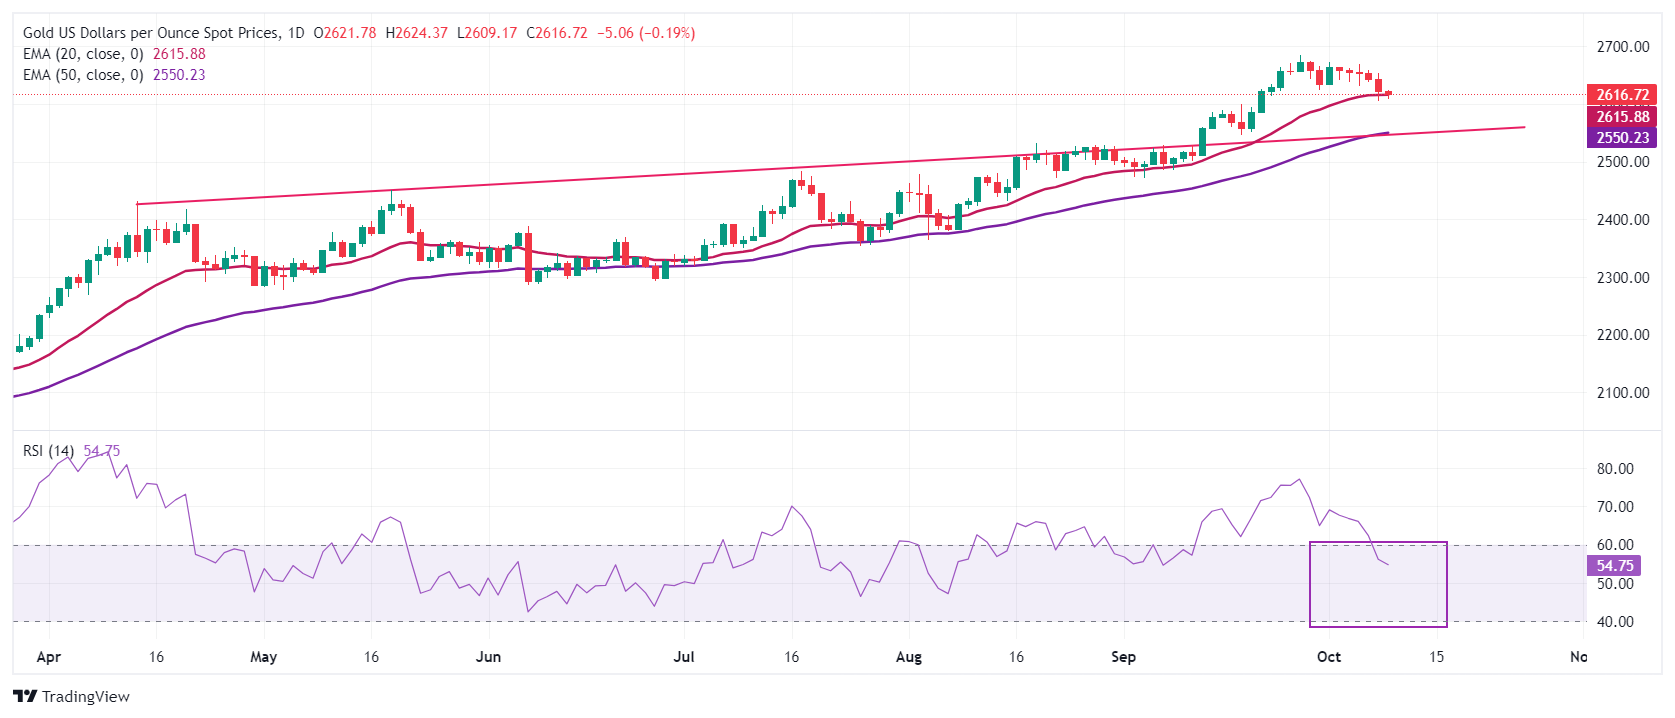
Gold price extends its correction to near $2,610 from its all-time high of $2,685 as profit-booking remains intact. However, the overall trend of the Gold price remains bullish as the 20- and 50-day Exponential Moving Averages (EMAs) at $2,615 and $2,550, respectively, are sloping higher.
Upward-sloping trendline from the April 12 high of $2,431.60 will act as major support for the Gold price bulls.
The 14-day Relative Strength Index (RSI) falls into the 40.00-60.00 range, suggesting a weakening of momentum. However, the upside trend remains intact.
Gold FAQs
Gold has played a key role in human’s history as it has been widely used as a store of value and medium of exchange. Currently, apart from its shine and usage for jewelry, the precious metal is widely seen as a safe-haven asset, meaning that it is considered a good investment during turbulent times. Gold is also widely seen as a hedge against inflation and against depreciating currencies as it doesn’t rely on any specific issuer or government.
Central banks are the biggest Gold holders. In their aim to support their currencies in turbulent times, central banks tend to diversify their reserves and buy Gold to improve the perceived strength of the economy and the currency. High Gold reserves can be a source of trust for a country’s solvency. Central banks added 1,136 tonnes of Gold worth around $70 billion to their reserves in 2022, according to data from the World Gold Council. This is the highest yearly purchase since records began. Central banks from emerging economies such as China, India and Turkey are quickly increasing their Gold reserves.
Gold has an inverse correlation with the US Dollar and US Treasuries, which are both major reserve and safe-haven assets. When the Dollar depreciates, Gold tends to rise, enabling investors and central banks to diversify their assets in turbulent times. Gold is also inversely correlated with risk assets. A rally in the stock market tends to weaken Gold price, while sell-offs in riskier markets tend to favor the precious metal.
The price can move due to a wide range of factors. Geopolitical instability or fears of a deep recession can quickly make Gold price escalate due to its safe-haven status. As a yield-less asset, Gold tends to rise with lower interest rates, while higher cost of money usually weighs down on the yellow metal. Still, most moves depend on how the US Dollar (USD) behaves as the asset is priced in dollars (XAU/USD). A strong Dollar tends to keep the price of Gold controlled, whereas a weaker Dollar is likely to push Gold prices up.
Recommended Articles


