

WTI Oil recovers on revival of 50 bps Fed cut bets and Hurricane Francine

Source Fxstreet
  • WTI Oil is rebounding off four-month lows on renewed expectations the Fed may cut interest rates by 50 bps. 
  • Supply closures from Hurricane Francine which is ravaging the Gulf of Mexico are another bullish factor. 
  • WTI is forming short-term bullish reversal patterns on the daily and weekly charts.  
     

West Texas Intermediate (WTI) crude Oil price is trading around the $69 per barrel level on Friday, as it rebounds from the over four-month lows posted on Tuesday. 

If Friday ends positively it will complete three up days in a row for WTI Oil – a bullish reversal pattern known as a Three White Soldiers by market technicians. On the weekly chart a bullish Hammer candlestick pattern also looks to be forming, which if it completes further suggests the possibility of a short-term recovery rally unfolding. 

Oil is rebounding on a mixture of a revival of hopes for a larger 50 bps (0.50%) cut in interest rates by the US Federal Reserve (Fed) at their up-and-coming meeting on September 17-18, and expectations of large mortgage rate cuts in China. 

Lower interest rates are positive for Oil because they lower the opportunity cost of holding a non interest-paying commodity. The cut in Chinese mortgage rates might help stimulate growth in China’s ailing economy, and China is Oil’s largest buyer. 

WTI Oil Daily Chart
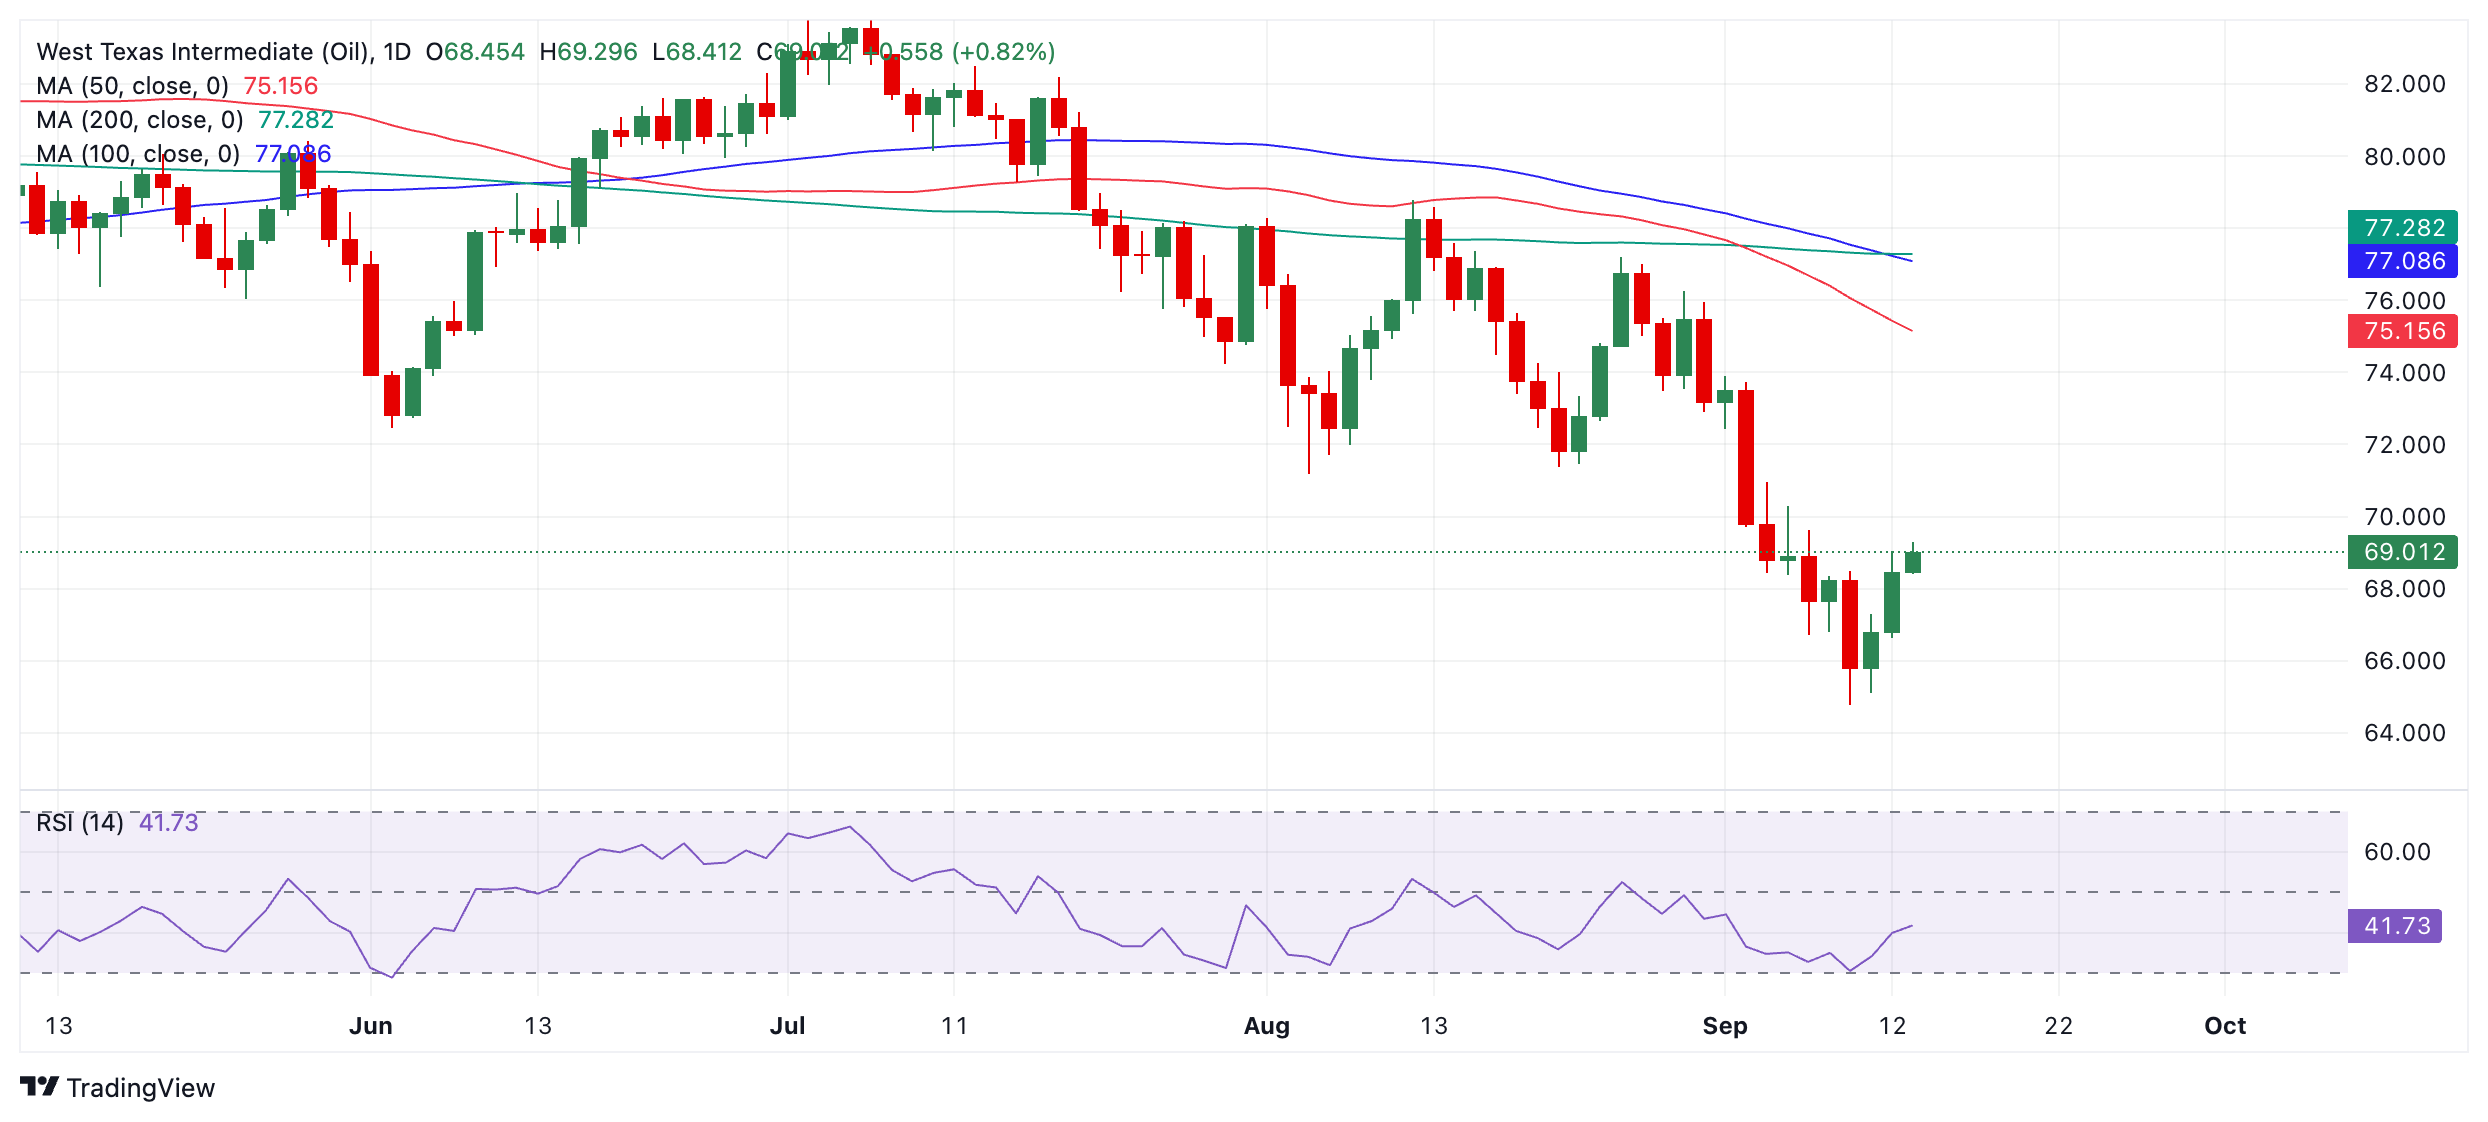


Hopes of a 50 bps cut by the Fed were given a new lease of life in the financial media over the last 24 hours after temporarily foundering on the release of robust core Consumer Price Index (CPI) inflation data earlier in the week. 

The renewal of market bets for a larger cut were sparked by an article in The Wall Street Journal (WSJ), in which a renowned Fed Watcher Nick Timiraos argued that a 50 bps cut was warranted. This was followed by a similar story in the Financial Times (FT), and a speech from former New York Fed President William Dudley who also advocated for a half-a-percent cut. The Two-year US Treasury yield dropped five points on the news and the USD saw further losses.

WTI Oil is also supported by news of Hurricane Francine which is ravaging the US Gulf of Mexico. An estimated 730,000 barrels of Oil per day, or 42% of the region’s production was outed on Thursday as a result of shutdowns caused by the hurricane. 

Despite these factors, upside for black gold may be limited by a broadly negative demand outlook. Both the Organization of Petroleum Exporting Countries (OPEC) and the International Energy Agency (IEA) lowered their demand growth forecasts earlier this week. This, to a larger extent, overshadows worries about output disruptions caused by Hurricane Francine and limits the upside for Crude Oil prices. 

The main reason for the negative outlook is China’s weakening economy. Recent data revealed that China's crude Oil imports were 3.1% lower from January to August 2024 compared to the same period in the previous year. Even if OPEC+ limits supply, a surplus of crude Oil is expected in 2024. In addition, US demand also remains tepid according to recent inventory figures.


Disclaimer: For information purposes only. Past performance is not indicative of future results.
placeholder
China's factories are pricing in 5.7%. Its shoppers are pricing in 0.7%.China's October PPI rose 5.7% year on year, the fastest since June 2022, while CPI slowed to 0.7% and core CPI to 0.8%. Input prices rose faster than factory-gate prices, squeezing mid-stream margins by roughly five percentage points. The Hang Seng fell 0.13% on a day the S&P 500 rose 2.35%, the only major market to sit out the risk-on session.
Author  Irene Q.
Nov 10, Tue
China's October PPI rose 5.7% year on year, the fastest since June 2022, while CPI slowed to 0.7% and core CPI to 0.8%. Input prices rose faster than factory-gate prices, squeezing mid-stream margins by roughly five percentage points. The Hang Seng fell 0.13% on a day the S&P 500 rose 2.35%, the only major market to sit out the risk-on session.
placeholder
Gold Price Analysis Today | Forex Gold Analysis | XAU/USD Analysis - November 11, 2026Get the latest gold price analysis, forex gold insights, and XAU/USD analysis for November 11, 2026. Read on for the details.
Author  Mitrade
Nov 11, Wed
Get the latest gold price analysis, forex gold insights, and XAU/USD analysis for November 11, 2026. Read on for the details.
placeholder
Gold Extends Slide Below $4,000 as Rising US Inflation, Fed December Hike Bets Pressure Prices On November 12, gold prices (XAUUSD) extended their recent losses, falling further below $4,000 in early Asian trading to hit an intraday low near $3,968, marking a third consecutive day
Author  TradingKey
Yesterday 02: 00
On November 12, gold prices (XAUUSD) extended their recent losses, falling further below $4,000 in early Asian trading to hit an intraday low near $3,968, marking a third consecutive day
placeholder
Gold closed below $4,000 again — the ETF crowd and central banks stayed, the momentum money leftSpot gold is trading near $3,999, its third consecutive lower daily low, after a 5.00% 10-year yield and a 102.85 dollar index raised the odds of a December hike to 87%. But the selling is not coming from the strategic holders: managed-money net longs fell to 324 tonnes, a 21-week low, and Goldman Sachs attributes roughly 95% of five weeks of selling to non-reportable positions. ETFs still hold a record 4,256 tonnes and central banks bought 321 tonnes in Q3. The table below sets the triggers, directions and levels.
Author  Irene Q.
Yesterday 03: 20
Spot gold is trading near $3,999, its third consecutive lower daily low, after a 5.00% 10-year yield and a 102.85 dollar index raised the odds of a December hike to 87%. But the selling is not coming from the strategic holders: managed-money net longs fell to 324 tonnes, a 21-week low, and Goldman Sachs attributes roughly 95% of five weeks of selling to non-reportable positions. ETFs still hold a record 4,256 tonnes and central banks bought 321 tonnes in Q3. The table below sets the triggers, directions and levels.
placeholder
US October PPI Preview: Fed Rate Hike Expectations Rise, PPI May Be Key Variable; How Will US Stocks, Dollar, and Gold Move?On Friday (Nov. 13) Eastern Time, the U.S. will release the October Producer Price Index (PPI). Following the October CPI once again exceeding expectations, the market will look to the PP
Author  TradingKey
Yesterday 08: 36
On Friday (Nov. 13) Eastern Time, the U.S. will release the October Producer Price Index (PPI). Following the October CPI once again exceeding expectations, the market will look to the PP
goTop
quote