


$4,000: Gold fights to hold its ground after sharp sell-off
- Gold attempts a recovery from July lows but remains on track for a weekly loss of more than 3%.
- Traders await US PMI and consumer sentiment data on Friday ahead of next week’s Fed interest rate decision.
- XAU/USD remains bearish below key moving averages, with RSI nearing oversold territory.
Gold (XAU/USD) attempts a recovery above the $4,000 mark on Friday after slipping to $3,986 during Asian trading hours, its lowest level since July. The rebound comes as dip buyers step in following Thursday’s sharp sell-off, when the metal lost 2.81%. At the time of writing, XAU/USD trades around $4,029, on track for a weekly loss of more than 3%.
Analysts at Rabobank describe “a brutal day for markets on Thursday,” noting that the S&P 500 fell “1.2% to $7663, dragged lower by the Philadelphia Stock Exchange Semiconductor index, which marched its way to the lowest level since July of this year.” The sharp equity sell-off was mirrored by a strong rally in government bonds, with Rabobank highlighting that “bad things for equities meant good things for US Treasuries, as the US 10-year yield moved back below 5% for the first time since September, despite higher energy prices, and the 2-year made its way back below 4.75%.”
Gold failed to benefit from Thursday’s equity slump and falling US Treasury yields as several factors weighed on the metal. Middle East tensions keep upward pressure on energy prices, with West Texas Intermediate Oil trading around $100 per barrel, near five-week highs. The resulting inflationary pressures reinforce expectations that interest rates will remain higher for longer. This increases the opportunity cost of holding non-yielding metal.
Some traders may also have sold precious metals to cover losses in equities. Technical selling likely added to the pressure after Gold broke below the $4,100-$4,200 range that largely held since the start of October.
Against this backdrop, Gold remains vulnerable to renewed selling on rebounds while the US Dollar and Treasury yields also show signs of stabilisation after Thursday’s declines. The US Dollar Index (DXY), which tracks the Greenback’s value against a basket of six major currencies, trades around 101.78, up 0.14%. The benchmark 10-year US Treasury yield stands at around 4.99%.
Later on Friday, traders will watch the preliminary S&P Global Purchasing Managers’ Index (PMI) readings for October and the University of Michigan’s final consumer sentiment survey, including inflation expectations.
All eyes on the Fed next week
The US central bank is widely expected to leave interest rates unchanged after raising them by 25 basis points (bps) in September. Traders will watch how policymakers balance persistent inflation risks against concerns that a slowdown in AI-related investment could weigh on economic growth. Any signal that another rate hike remains possible in December could limit Gold’s recovery.
Technical analysis: $4,000 at risk as technical indicators favor sellers
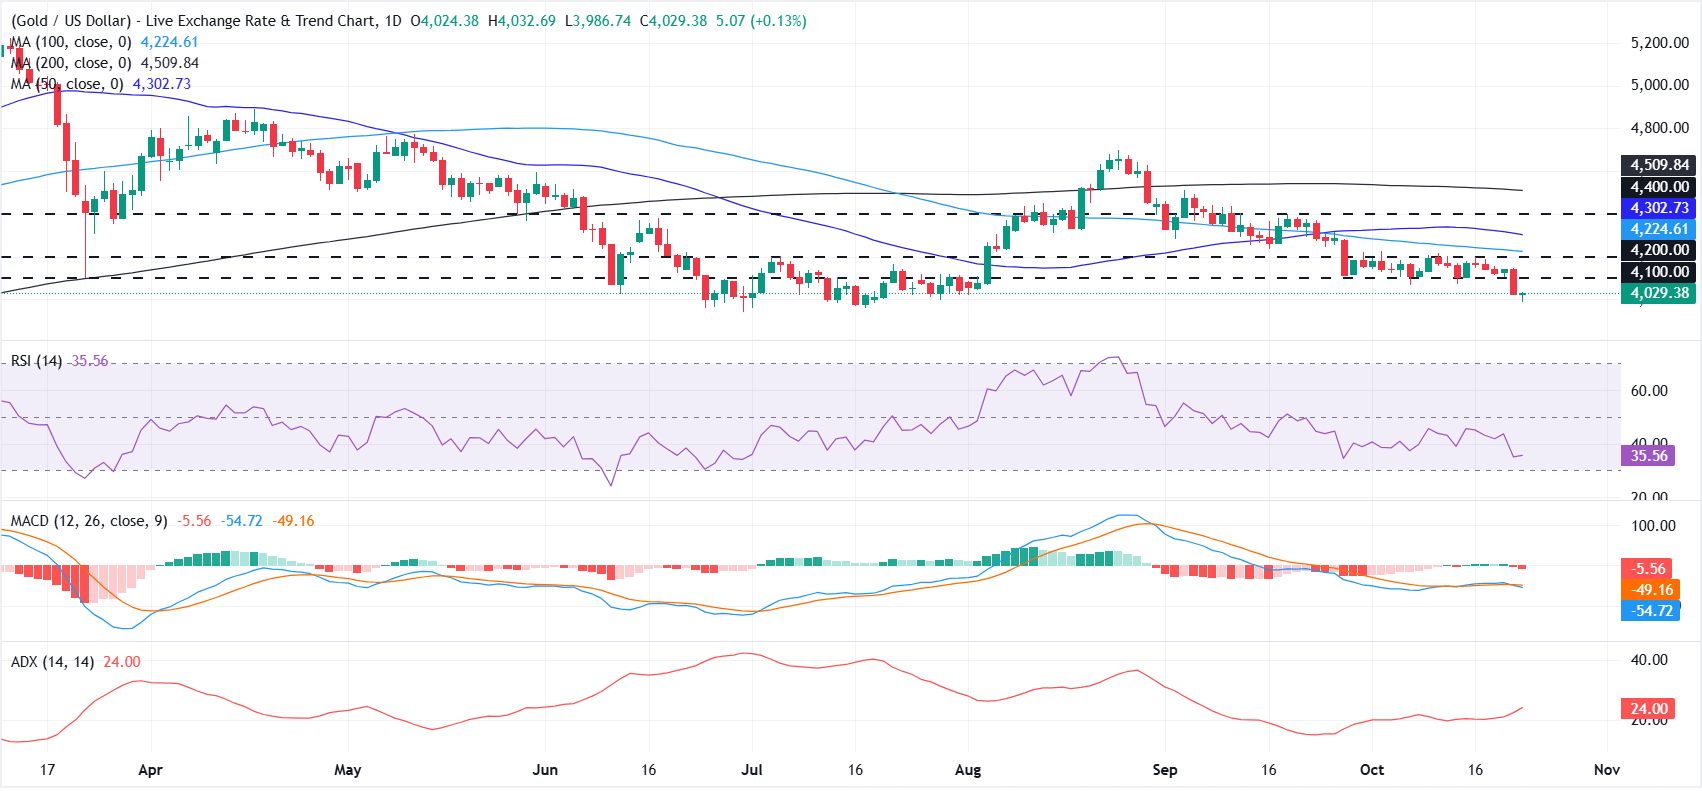
On the daily chart, XAU/USD extends its correction below all major moving averages and retains a bearish near-term bias. Momentum conditions are weak, with the Relative Strength Index (RSI) hovering near 35 and edging toward oversold territory, and the Moving Average Convergence Divergence (MACD) indicator holding below zero with a negative reading, hinting that downside forces still prevail despite a modestly rising Average Directional Index (ADX) around 24 that points to a gradually strengthening trend.
On the topside, immediate resistance emerges at the psychological $4,100 level, followed by another horizontal barrier at $4,200, which reinforces the nearby 100-day Simple Moving Average (SMA) at $4,224 as a key hurdle for any recovery attempts. Above that, the 50-day SMA at $4,302 guards the path toward the $4,400 zone, while the 200-day SMA at $4,509 caps the broader bearish structure.
On the downside, failure to hold above the psychological $4,000 mark could trigger deeper losses, exposing the $3,950 level as initial support, followed by the $3,900 zone. A sustained break below the latter could open the door for a further decline toward $3,800.
(The technical analysis of this story was written with the help of an AI tool. Know more.)
Gold FAQs
Gold has played a key role in human’s history as it has been widely used as a store of value and medium of exchange. Currently, apart from its shine and usage for jewelry, the precious metal is widely seen as a safe-haven asset, meaning that it is considered a good investment during turbulent times. Gold is also widely seen as a hedge against inflation and against depreciating currencies as it doesn’t rely on any specific issuer or government.
Central banks are the biggest Gold holders. In their aim to support their currencies in turbulent times, central banks tend to diversify their reserves and buy Gold to improve the perceived strength of the economy and the currency. High Gold reserves can be a source of trust for a country’s solvency. Central banks added 1,136 tonnes of Gold worth around $70 billion to their reserves in 2022, according to data from the World Gold Council. This is the highest yearly purchase since records began. Central banks from emerging economies such as China, India and Turkey are quickly increasing their Gold reserves.
Gold has an inverse correlation with the US Dollar and US Treasuries, which are both major reserve and safe-haven assets. When the Dollar depreciates, Gold tends to rise, enabling investors and central banks to diversify their assets in turbulent times. Gold is also inversely correlated with risk assets. A rally in the stock market tends to weaken Gold price, while sell-offs in riskier markets tend to favor the precious metal.
The price can move due to a wide range of factors. Geopolitical instability or fears of a deep recession can quickly make Gold price escalate due to its safe-haven status. As a yield-less asset, Gold tends to rise with lower interest rates, while higher cost of money usually weighs down on the yellow metal. Still, most moves depend on how the US Dollar (USD) behaves as the asset is priced in dollars (XAU/USD). A strong Dollar tends to keep the price of Gold controlled, whereas a weaker Dollar is likely to push Gold prices up.
Recommended Articles


