


Oil looks set to reach $90 despite US production at near full capacity
- WTI Oil closed off Thursday at $82.82, close to a fresh five-month high.
- Oil traders remain bullish despite recent US stockpile build-ups.
- The US Dollar Index trades in the green, and could post a fresh monthly high.
Oil prices have been heading higher in recent weeks, with several elements painting a rather sketchy picture of the US status in the global Oil market. Any bearish moves in recent weeks were often attributed to the fact that the US was flooding the markets with Oil in order to temper prices. However, Bloomberg reports that the US Energy Department is very active in buying Oil at current prices to rebuild a 40-year low in US strategic reserves, which means that the US is dumping Oil to get prices lower while it is buying that same Oil back at a higher price.
The US Dollar, meanwhile, is roaring again with the US Dollar bulls performing a four-day winning streak ahead of the US Personal Consumption Expenditures (PCE) Price Index numbers. Markets are on edge as recent inflation measures have pointed to an uptick in price pressures. If the PCE points to accelerating inflation, this could result in markets starting to cut back the number of interest-rate cuts expected for this year, pushing back further down the initial rate cut from the US Federal Reserve.
Crude Oil (WTI) closed off at $82.82 per barrel, and Brent Oil closed off at $86.82 per barrel on Thursday evening.
Oil could set sail to $90 as US attempts fail to outweigh OPEC production cuts
- Next Wednesday, OPEC will meet to discuss and decide on the current production cuts. Expectations are that Saudi Arabia will prolong its part until the end of this year.
- Despite Easter Monday, the US Energy Information Administration will release the US stockpile changes for this week on Wednesday as normal.The American Petroleum Institute will release overnight figures on Tuesday as usual.
- Quite a number of Oil tankers are reporting to be stuck in Venezuela off the coast. Traders that jumped on the easing of sanctions against the country are now facing issues with the tankers unable to load.
Oil Technical Analysis: US strategic reserve build-up economics
Oil prices are set to head higher as the game of chicken between the US and OPEC appears to be falling in favor of the Oil cartel. The US is unable to oversupply markets with oil as it is unable to match the production cuts from Saudi Arabia and Russia. Being forced to restock its strategic reserves, the US is paying a very expensive price in its economic war with Russia and OPEC, while it creates a second-round effect in US inflation with prices at the gas pumps remaining fragile for upswings.
Oil bulls will see $86 appearing as the next cap. Further up, $86.90 follows suit before targeting $89.64 and $93.98 as top levels.
On the downside, both $80.00 and $80.60 should be acting as support with the 200-day Simple Moving Average (SMA) as the level to catch any falling knives near $78.55. The 100-day and the 55-day SMA’s are near $75.64 and $77.15, respectively. Add the pivotal level near $75.27, and it looks like the downside is very limited and well-equipped to resist the selling pressure.
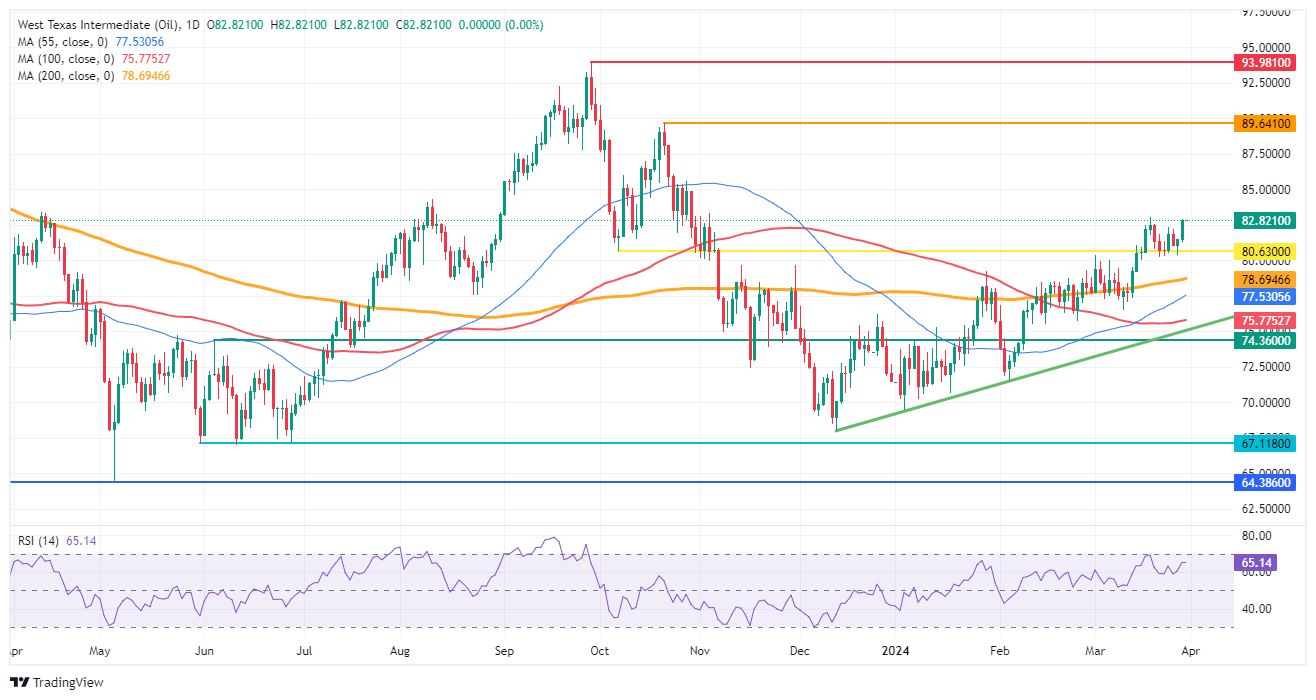
US WTI Crude Oil: Daily Chart
WTI Oil FAQs
WTI Oil is a type of Crude Oil sold on international markets. The WTI stands for West Texas Intermediate, one of three major types including Brent and Dubai Crude. WTI is also referred to as “light” and “sweet” because of its relatively low gravity and sulfur content respectively. It is considered a high quality Oil that is easily refined. It is sourced in the United States and distributed via the Cushing hub, which is considered “The Pipeline Crossroads of the World”. It is a benchmark for the Oil market and WTI price is frequently quoted in the media.
Like all assets, supply and demand are the key drivers of WTI Oil price. As such, global growth can be a driver of increased demand and vice versa for weak global growth. Political instability, wars, and sanctions can disrupt supply and impact prices. The decisions of OPEC, a group of major Oil-producing countries, is another key driver of price. The value of the US Dollar influences the price of WTI Crude Oil, since Oil is predominantly traded in US Dollars, thus a weaker US Dollar can make Oil more affordable and vice versa.
The weekly Oil inventory reports published by the American Petroleum Institute (API) and the Energy Information Agency (EIA) impact the price of WTI Oil. Changes in inventories reflect fluctuating supply and demand. If the data shows a drop in inventories it can indicate increased demand, pushing up Oil price. Higher inventories can reflect increased supply, pushing down prices. API’s report is published every Tuesday and EIA’s the day after. Their results are usually similar, falling within 1% of each other 75% of the time. The EIA data is considered more reliable, since it is a government agency.
OPEC (Organization of the Petroleum Exporting Countries) is a group of 13 Oil-producing nations who collectively decide production quotas for member countries at twice-yearly meetings. Their decisions often impact WTI Oil prices. When OPEC decides to lower quotas, it can tighten supply, pushing up Oil prices. When OPEC increases production, it has the opposite effect. OPEC+ refers to an expanded group that includes ten extra non-OPEC members, the most notable of which is Russia.
Recommended Articles


