AUD/JPY Price Analysis: Aussie dips slightly as 20-day SMA offers support

Source Fxstreet
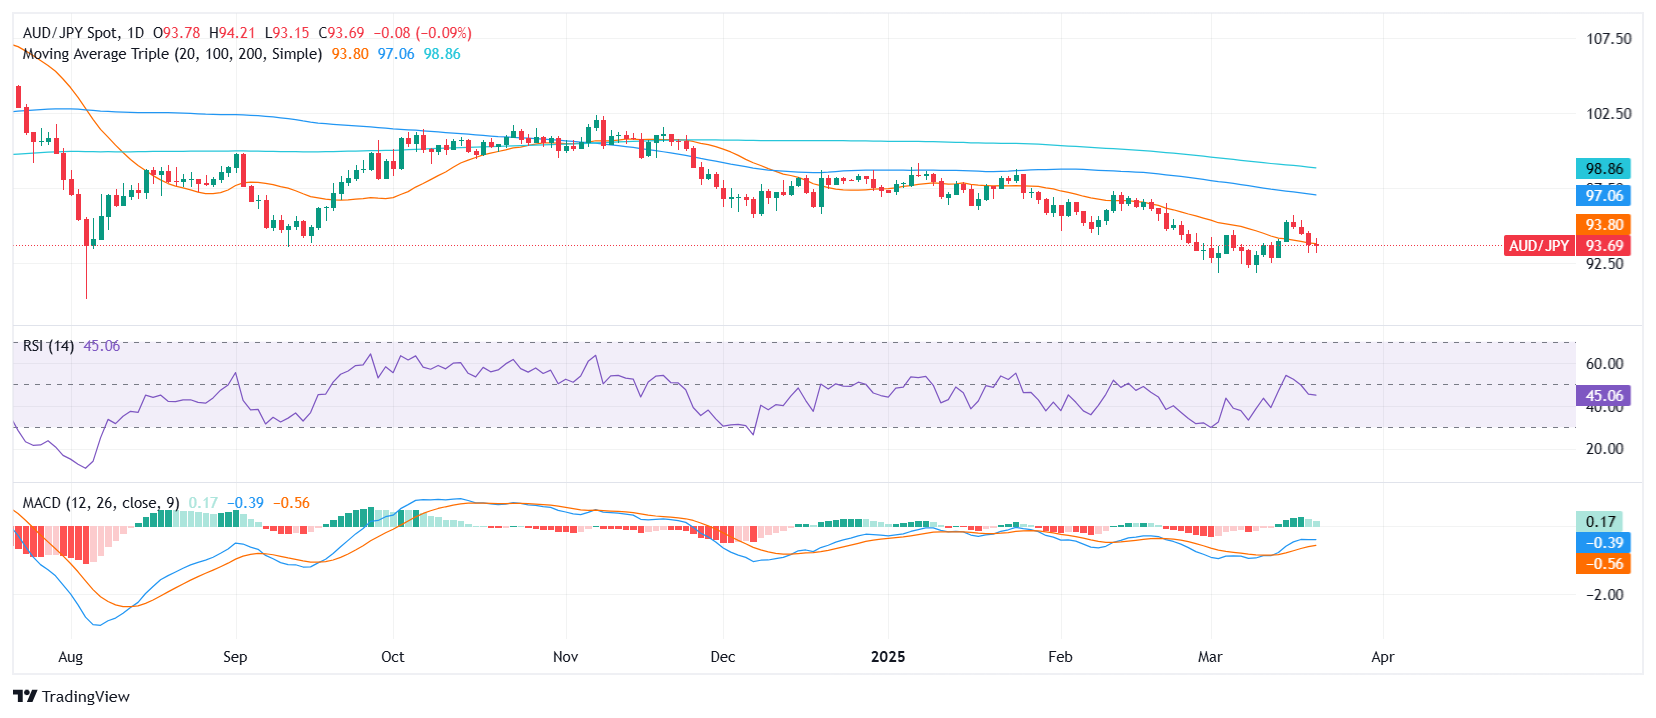
  • AUD/JPY was seen trading around the 93.70 zone, recording its third consecutive day of mild losses.
  • Despite the negative streak, the pair continues to hold above the 20-day SMA, suggesting downside may be limited.
  • Momentum indicators remain soft; RSI stays in negative territory while MACD shows flat green bars.

On Friday’s session the AUD/JPY edged slightly lower and was seen trading in the 93.70 area. The pair has now posted three straight sessions of mild declines, though it remains above a key support level. Price action shows some hesitation from sellers, as bulls attempt to defend the 20-day Simple Moving Average, hinting at a potential pause in downside pressure.

The Relative Strength Index (RSI) is currently positioned in negative territory, mildly declining near the mid-40s, which reflects limited bearish momentum. Meanwhile, the Moving Average Convergence Divergence (MACD) remains in positive territory, but its histogram shows flat green bars, signaling a lack of strong directional conviction.

From a trend perspective, holding above the 20-day SMA, currently near the 93.50 region, keeps the short-term outlook slightly tilted to the upside. A break below this level could shift sentiment and open the door toward 93.00 or even the 92.50 area. On the flip side, resistance lies around 94.20, followed by the psychological 95.00 mark.

AUD/JPY daily chart


Disclaimer: For information purposes only. Past performance is not indicative of future results.
placeholder
Solana Price Eyes $70 as Founder Anatoly Yakovenko Bins Narrative That SOL Is an Ethereum KillerSolana founder Anatoly Yakovenko has binned the narrative that SOL is an Ethereum killer. It is okay for the two technologies to have overlapping features and compete.
Author  FXStreet
Dec 04, 2023
Solana founder Anatoly Yakovenko has binned the narrative that SOL is an Ethereum killer. It is okay for the two technologies to have overlapping features and compete.
placeholder
Hidden Bullish Divergence Appears On Dogecoin Price Chart, Here’s What To Expect NextA hidden Bullish Divergence pattern has just been identified on the Dogecoin price chart, signaling possibilities of a significant uptrend. With this new technical pattern, a crypto analyst has projected a target of $0.7 for the Dogecoin price.
Author  Bitcoinist
Nov 22, 2024
A hidden Bullish Divergence pattern has just been identified on the Dogecoin price chart, signaling possibilities of a significant uptrend. With this new technical pattern, a crypto analyst has projected a target of $0.7 for the Dogecoin price.
placeholder
OKX is preparing to go public in the United StatesOKX, one of the largest cryptocurrency exchanges by trading volume, is preparing to go public in the United States.
Author  Cryptopolitan
Jun 23, 2025
OKX, one of the largest cryptocurrency exchanges by trading volume, is preparing to go public in the United States.
placeholder
Markets in 2026: Will gold, Bitcoin, and the U.S. dollar make history again? — These are how leading institutions thinkAfter a turbulent 2025, what lies ahead for commodities, forex, and cryptocurrency markets in 2026?
Author  Insights
Dec 25, 2025
After a turbulent 2025, what lies ahead for commodities, forex, and cryptocurrency markets in 2026?
placeholder
Gold gains momentum above $4,100 after weak US NFP data Gold price (XAU/USD) gains traction to around $4,125 during the early Asian session on Friday. The precious metal extends the rally after weaker-than-expected US Nonfarm Payrolls ‌(NFP) data reduced expectations of Federal Reserve (Fed) interest rate hikes this year.
Author  FXStreet
Yesterday 01: 43
Gold price (XAU/USD) gains traction to around $4,125 during the early Asian session on Friday. The precious metal extends the rally after weaker-than-expected US Nonfarm Payrolls ‌(NFP) data reduced expectations of Federal Reserve (Fed) interest rate hikes this year.
Related Instrument
goTop
quote