

NZD/USD Price Analysis: Pair trades higher in recovery as buyers attempt to take control

Source Fxstreet
  • NZD/USD gained further ground around 0.5900.
  • Buyers gained further ground and pushed back the sellers’ attempts as indicators continue in recovery mode.
  • The pair might continue to gain ground as it moves closer to its 20-day SMA at 0.5960.

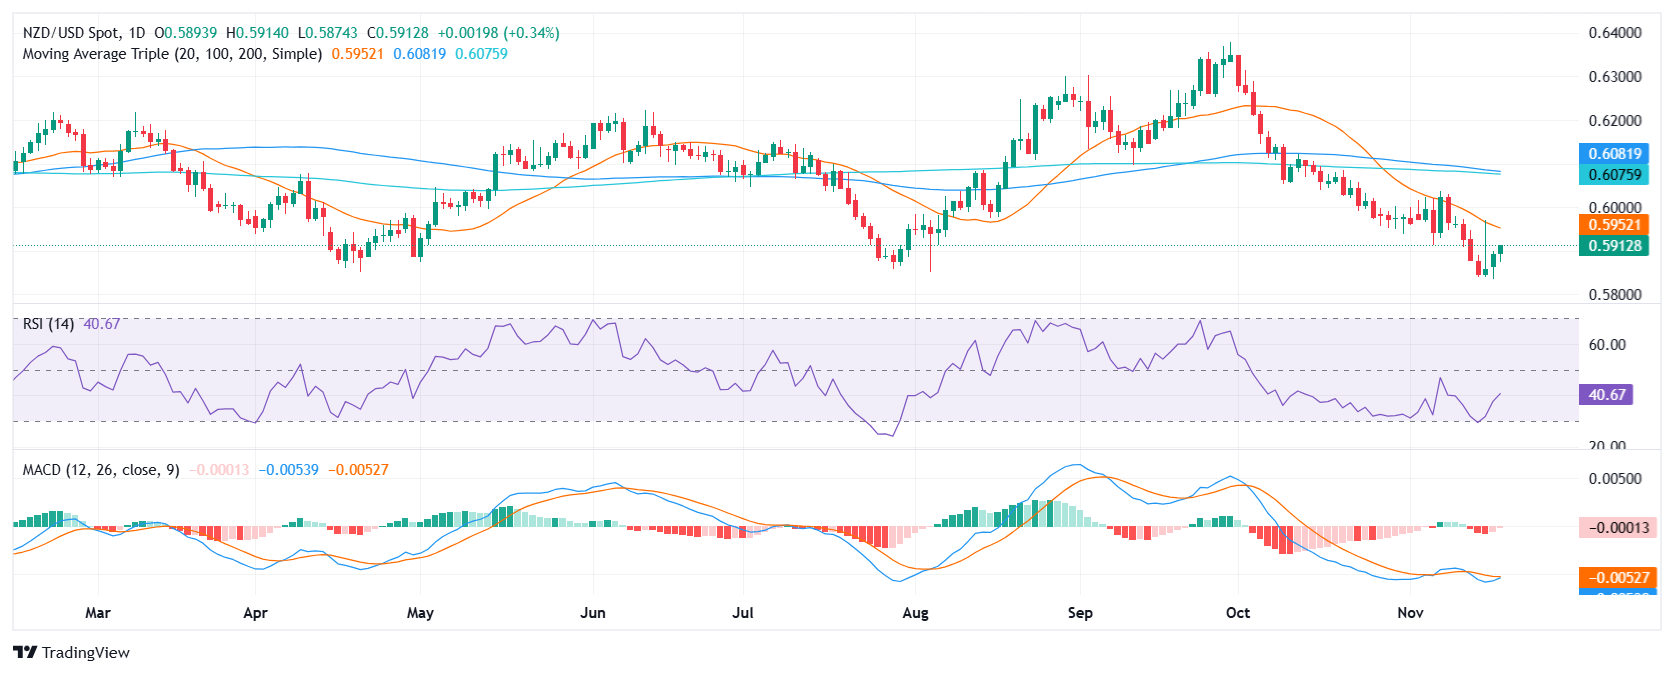
The NZD/USD climbed by 0.31% to 0.5910 in Tuesday's session, continuing its recovery as buyers gained further ground and pushed back the sellers' attempts. Indicators such as the Relative Strength Index (RSI) and Moving Average Convergence Divergence (MACD) continue to recover, signaling a mixed momentum.

From a technical perspective, the NZD/USD's outlook is mixed with signs of a bullish recovery. The RSI's rise to 43 with its sharp upward slope suggests increasing buying pressure in the negative area and a potential recovery in bullish momentum. Additionally, the MACD's decreasing red histogram indicates a loss of bearish momentum. These mixed signals suggest a potential shift in market sentiment from bearish to bullish.

The NZD/USD pair's recovery continues as buyers regain control and push back sellers. The pair seems to be on its way towards the the 20-day Simple Moving Average (SMA) at 0.5960. As the pair trades near key resistance levels, a breakout above this level could strengthen bullish momentum, while a drop below 0.5900 could indicate a bearish reversal.

NZD/USD daily chart
Disclaimer: For information purposes only. Past performance is not indicative of future results.
placeholder
Pi Network Price Annual Forecast: PI Heads Into a Volatile 2026 as Utility Questions Collide With Big UnlocksPi Network heads into 2026 after a 90%+ 2025 drawdown from $3.00, with 17.5 million KYC users and a smart-contract-focused Stellar v23 upgrade offering upside potential, but 1.21 billion tokens unlocking and heavy exchange deposits (437 million PI) keeping supply pressure and trust risks firmly in focus.
Author  Mitrade
Dec 19, 2025
Pi Network heads into 2026 after a 90%+ 2025 drawdown from $3.00, with 17.5 million KYC users and a smart-contract-focused Stellar v23 upgrade offering upside potential, but 1.21 billion tokens unlocking and heavy exchange deposits (437 million PI) keeping supply pressure and trust risks firmly in focus.
placeholder
Markets in 2026: Will gold, Bitcoin, and the U.S. dollar make history again? — These are how leading institutions thinkAfter a turbulent 2025, what lies ahead for commodities, forex, and cryptocurrency markets in 2026?
Author  Insights
Dec 25, 2025
After a turbulent 2025, what lies ahead for commodities, forex, and cryptocurrency markets in 2026?
placeholder
ECB Policy Outlook for 2026: What It Could Mean for the Euro’s Next MoveWith the ECB likely holding rates steady at 2.15% and the Fed potentially extending cuts into 2026, EUR/USD may test 1.20 if Eurozone growth proves resilient, but weaker growth and an ECB pivot could pull the pair back toward 1.13 and potentially 1.10.
Author  Mitrade
Dec 26, 2025
With the ECB likely holding rates steady at 2.15% and the Fed potentially extending cuts into 2026, EUR/USD may test 1.20 if Eurozone growth proves resilient, but weaker growth and an ECB pivot could pull the pair back toward 1.13 and potentially 1.10.
placeholder
US Dollar Index Price Forecast: DXY eyes 99.75 confluence hurdle amid Fed bets, Iran risksThe US Dollar Index (DXY), which tracks the Greenback against a basket of currencies, regains positive traction on Tuesday and climbs back above the mid-99.00s during the first half of the European session.
Author  FXStreet
Sep 01, Tue
The US Dollar Index (DXY), which tracks the Greenback against a basket of currencies, regains positive traction on Tuesday and climbs back above the mid-99.00s during the first half of the European session.
placeholder
Gold Price Forecast: Will Gold Keep Falling After Dropping Below $4,300 as US-Iran Conflict Drives Up Oil Prices?As of the Asian trading session on September 2, gold prices (XAUUSD) fell below $4,300 intraday to a low of $4,282.45, with the latest price hovering around $4,320, down nearly 9% cumulat
Author  TradingKey
Yesterday 09: 10
As of the Asian trading session on September 2, gold prices (XAUUSD) fell below $4,300 intraday to a low of $4,282.45, with the latest price hovering around $4,320, down nearly 9% cumulat
Related Instrument
goTop
quote