


BNB (BNBUSD) Suddenly Goes down 1.00% on Oct 18: What You Need to Watch
BNB (BNBUSD) is down 1.00% at Oct 18 11:40(ET), now at $710.7, with a 7-day down of 5.50%.
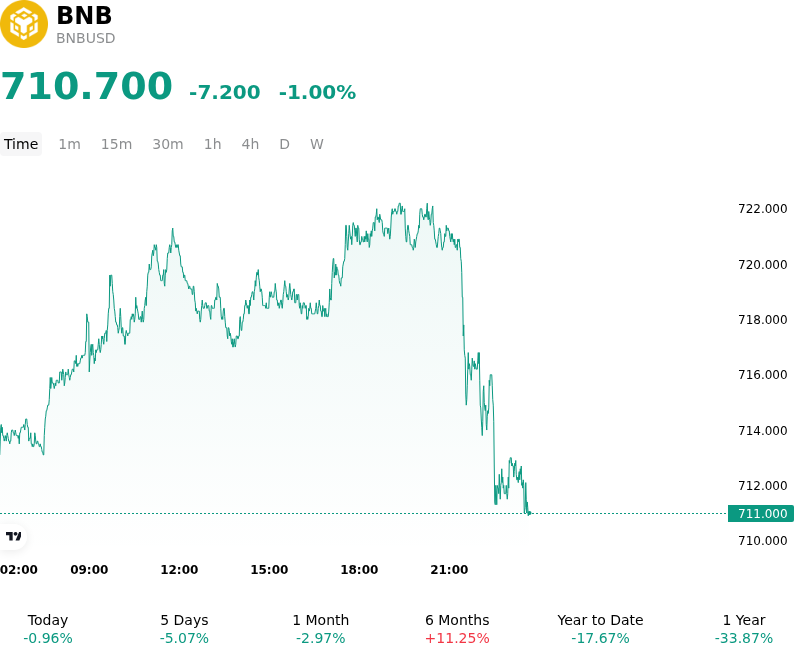
What is driving BNB (BNBUSD)’s stock price down today?
The pullback in BNB reflects a combination of macroeconomic headwinds, tightening risk-asset liquidity, and short-term capital rebalancing across major Layer-1 ecosystems. Broader digital asset markets have faced ongoing pressure as elevated Treasury yields and persistent Federal Reserve policy uncertainty weigh on overall market sentiment. With traditional fixed-income yields maintaining an attractive risk-free hurdle rate, institutional capital flows into non-yielding digital assets have remained constrained, prompting investors to trim exposure across high-beta large-cap tokens.
From an asset-specific perspective, the downside move was driven by localized capital outflows and short-term profit taking near key technical resistance levels. Following a period of consolidation around short-term exponential moving averages, spot demand for BNB softened as market participants rotated capital into defensive positions and stablecoin holdings. Derivatives positioning also contributed to the soft intraday price action, with light long unwinding and a modest contraction in futures open interest indicating a temporary reduction in speculative leverage.
Despite the near-term price concession, structural support for the asset remains anchored by the underlying mechanics of the BNB Smart Chain network. Continuous supply reduction through automated token burn events, alongside sustained transaction utility across centralized exchange infrastructure and decentralized applications, continues to provide a mid-to-long-term valuation floor. Nevertheless, in the absence of a clear macro liquidity catalyst, institutional and retail investors continue to favor a disciplined, range-bound trading approach while monitoring broader cross-asset risk conditions.
Technical Analysis of BNB (BNBUSD)
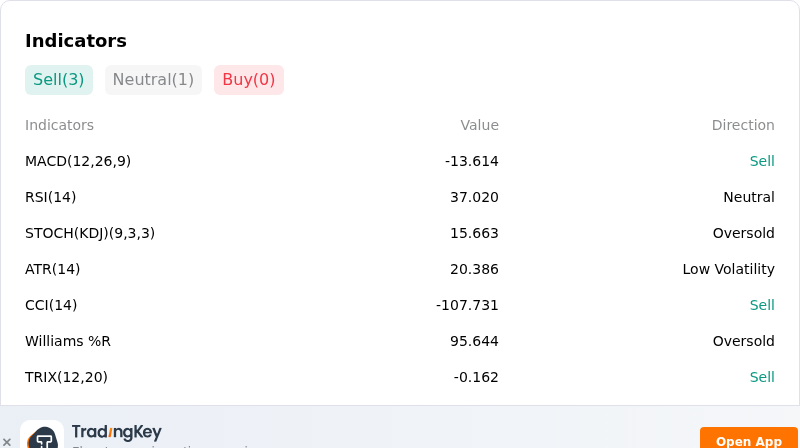
Technically, BNB (BNBUSD) shows a MACD (12,26,9) value of -13.639, indicating a sell signal. The RSI at 36.963 suggests neutral condition and the Williams %R at 95.842 suggests oversold condition. Please monitor closely.
More details about BNB (BNBUSD)
Recent Events and Risks:
- Technical Support Breakdown and Derivatives Liquidations: BNB breached key short-term support levels around $730–$740, triggering localized long-position liquidations across perpetual swap markets and exposing the price action to deeper downside tests toward $700 and $680.
- On-Chain Whale Exchange Inflows: On-chain monitoring revealed multiple large transfers of BNB from whale wallets directly onto exchange deposit addresses, raising market concerns over imminent spot sell-side pressure and liquidation cascades.
- Regulatory Scrutiny and Exchange Overhang: Ongoing global regulatory friction surrounding Binance's operational licensing and compliance under international frameworks like Europe's MiCA continues to depress investor sentiment, amplifying downside volatility during market pullbacks.
- Macro Headwinds and Reduced Capital Liquidity: Rising U.S. Treasury yields and broader macroeconomic risk-off sentiment have constrained digital asset liquidity, driving spot outflows from major altcoins and restricting immediate institutional dip-buying interest.
Recommended Articles


