


GBP/USD churns ahead of UK wages and labor figures
- GBP/USD continues to battle markets just above 1.3000.
- Cable traders are buckling down ahead of Tuesday’s key UK labor figures.
- UK CPI inflation, US Retail Sales figures due later in the week.
GBP/USD churned chart paper just north of 1.3000 on Monday, with markets striking a laid-back tone ahead of key UK data due to release in the first half of the trading week. UK wages and jobs additions are slated for early Tuesday, with UK Consumer Price Index (CPI) and Producer Price Index (PPI) inflation in the barrel for Wednesday. US Retail Sales figures will round out the middle of the week on Thursday, followed by UK Retail Sales slated for Friday’s London market session.
Markets are looking for a continued easing in UK labor figures for the quarter ended in August. Median market forecasts expect a headline print of Average Earnings Excluding Bonus to tick back to 4.9% for the annualized quarter ended in August, down from the previous 5.1%. The UK’s Claimant Count Change is expected to ease down to 20.2K in September from August’s 23.7K, while the UK’s ILO Unemployment Rate is expected to hold steady at 4.1% for the three month period ended in August.
It’s a GBP-forward data docket in the first half of the trading week; UK CPI inflation figures will followup on Wednesday, with headline YoY CPI inflation expected to ease down to 1.9% from the previous 2.2%, though core CPI UK inflation is expected to continue riding much higher, but still soften to 3.4% from 3.6%.
Meaningful US data isn’t due until Thursday’s US Retail Sales, expected to accelerate to 0.3% MoM in September after August’s lackluster 0.1%. However, Cable traders will be largely focused on Thursday’s Bank of England (BoE) Monetary Policy Report Hearings. UK Retail Sales figures will wrap up the trading week on Friday, where investors are expecting figures to backslide to -0.3% MoM in September from the previous 1.0%.
GBP/USD price forecast
Cable shows a recent shift in momentum on daily candlesticks after the pair moved below its 50-day Exponential Moving Average (EMA) at 1.31050 and is currently roiling near 1.3050. GBP/USD has seen a significant pullback after peaking in late September, and the 50-day EMA is starting to flatten, suggesting a potential weakening of the bullish trend. The pair remains above the 200-day EMA at 1.28450, providing a crucial longer-term support level.
From a momentum perspective, the Moving Average Convergence-Divergence (MACD) is signaling bearish pressure. The MACD line (blue) has crossed below the signal line (orange), with the histogram showing deepening negative bars. This suggests that the selling momentum is picking up, and the pair may face further downside risks if the current trend continues. The MACD histogram’s movement below zero indicates a bearish divergence, confirming the downtrend's strength.
Key support levels to watch include the psychological 1.3000 level and the 200-day EMA around 1.28450, which could act as critical buffers. On the upside, the 50-day EMA near 1.31050 serves as a resistance zone. A break above this level would be necessary to regain bullish momentum. However, as long as the pair stays below the 50-day EMA, the outlook remains cautious, with the potential for further downside in the short term.
GBP/USD daily chart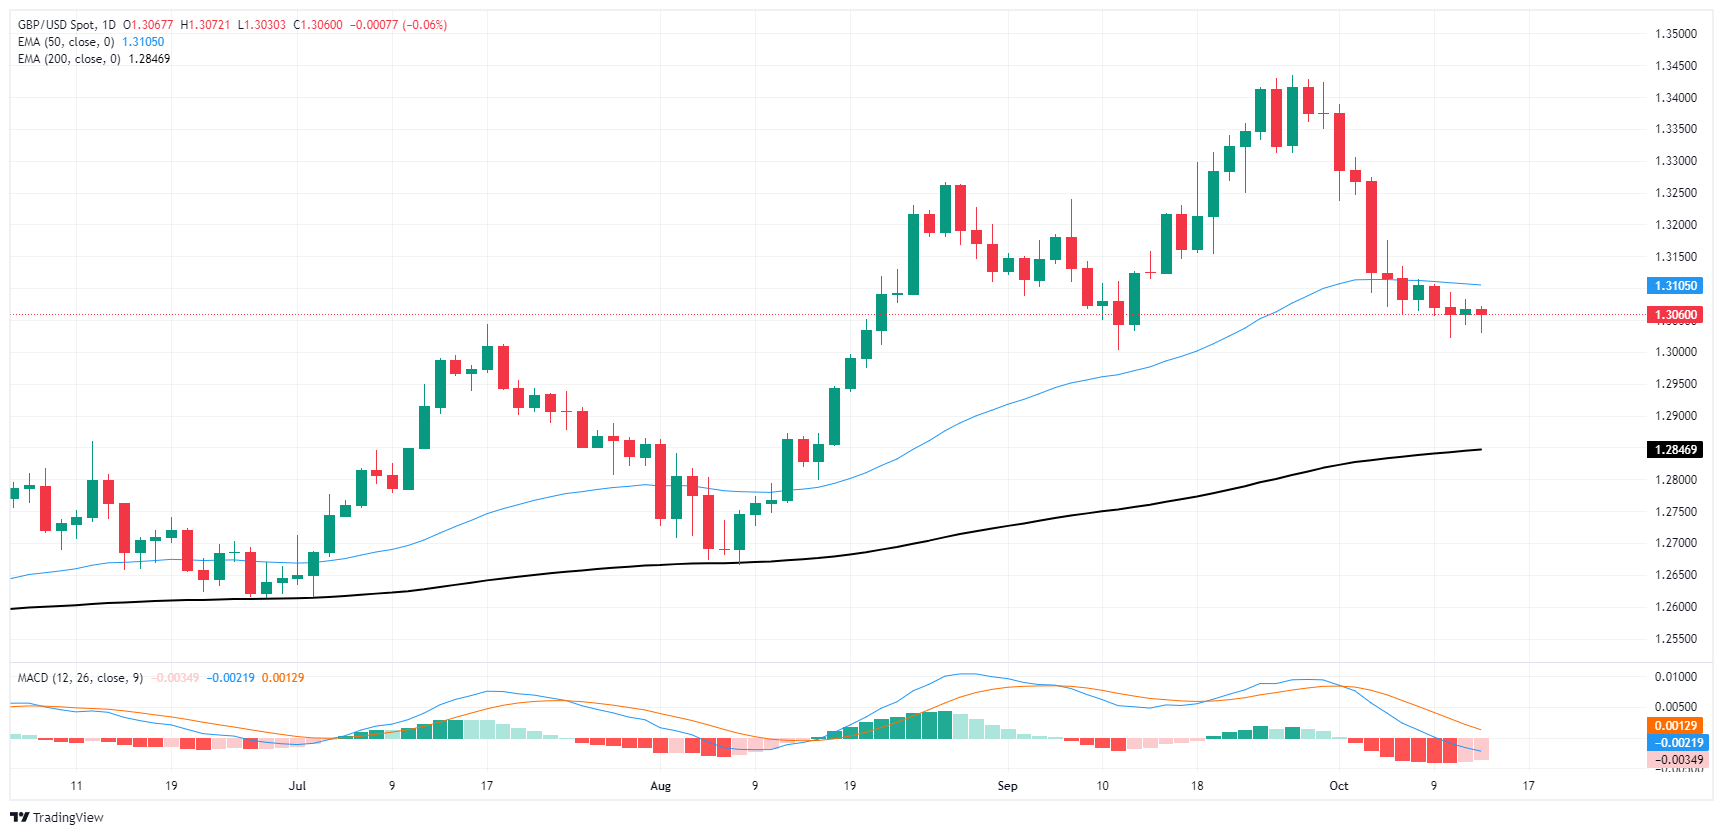
Pound Sterling FAQs
The Pound Sterling (GBP) is the oldest currency in the world (886 AD) and the official currency of the United Kingdom. It is the fourth most traded unit for foreign exchange (FX) in the world, accounting for 12% of all transactions, averaging $630 billion a day, according to 2022 data. Its key trading pairs are GBP/USD, also known as ‘Cable’, which accounts for 11% of FX, GBP/JPY, or the ‘Dragon’ as it is known by traders (3%), and EUR/GBP (2%). The Pound Sterling is issued by the Bank of England (BoE).
The single most important factor influencing the value of the Pound Sterling is monetary policy decided by the Bank of England. The BoE bases its decisions on whether it has achieved its primary goal of “price stability” – a steady inflation rate of around 2%. Its primary tool for achieving this is the adjustment of interest rates. When inflation is too high, the BoE will try to rein it in by raising interest rates, making it more expensive for people and businesses to access credit. This is generally positive for GBP, as higher interest rates make the UK a more attractive place for global investors to park their money. When inflation falls too low it is a sign economic growth is slowing. In this scenario, the BoE will consider lowering interest rates to cheapen credit so businesses will borrow more to invest in growth-generating projects.
Data releases gauge the health of the economy and can impact the value of the Pound Sterling. Indicators such as GDP, Manufacturing and Services PMIs, and employment can all influence the direction of the GBP. A strong economy is good for Sterling. Not only does it attract more foreign investment but it may encourage the BoE to put up interest rates, which will directly strengthen GBP. Otherwise, if economic data is weak, the Pound Sterling is likely to fall.
Another significant data release for the Pound Sterling is the Trade Balance. This indicator measures the difference between what a country earns from its exports and what it spends on imports over a given period. If a country produces highly sought-after exports, its currency will benefit purely from the extra demand created from foreign buyers seeking to purchase these goods. Therefore, a positive net Trade Balance strengthens a currency and vice versa for a negative balance.
Recommended Articles


