

GBP/USD snaps five-day losing streak but gains remain tepid
- GBP/USD pumped the brakes on recent losses but remains below the 50-day EMA.
- Latest Fed Meeting Minutes due Wednesday, UK MPC policy hearings on Thursday.
- Investor hopes for an extended acceleration of Fed rate cuts have vanished.
GBP/USD pulled the plug on a five-day losing streak, closing a scant one-sixth of a percent in the green on Tuesday. Despite Cable bidders successfully snapping the near-term losing streak, the pair remains stubbornly on the low side of the 50-day Exponential Moving Average (EMA).
UK data remains thin in the front half of the trading week, leaving GBP traders to twiddle their thumbs until the Bank of England’s (BoE) Monetary Policy Report Hearings, slated for Thursday. UK Gross Domestic Product (GDP) figures will follow on Friday.
The Federal Reserve’s (Fed) latest Meeting Minutes from the September rate cut meeting will be released on Wednesday, giving Greenback traders plenty to chew on. Markets widely hoped for a follow-up double rate cut in November after the Fed blew the doors open with a jumbo 50 bps rate trim in September. However, core inflation still holding above Fed target levels and US labor figures that wildly outran expectations last week have firmly depressed rate cut hopefuls.
According to the CME’s FedWatch Tool, rate markets see nearly 90% odds that the Fed will follow up September’s jumbo 50 bps rate cut with a more modest 25 bps on November 7. Fed officials widely telegraphed that a weakening in the US labor market would be required to push the Federal Reserve into further outsized rate trims.
GBP/USD price forecast
GBP/USD is experiencing a short-term correction after a strong uptrend. The key level to watch is the 50-day EMA, which currently acts as resistance. A break above this level could reignite bullish momentum. However, the bearish signals from the MACD and the price's failure to maintain above the 50-day EMA suggest that traders should remain cautious. If the price dips below the 1.30 support, it could signal a deeper correction toward the 200-day EMA. Conversely, a break above the 50-day EMA would indicate that the bulls are regaining control.
GBP/USD daily chart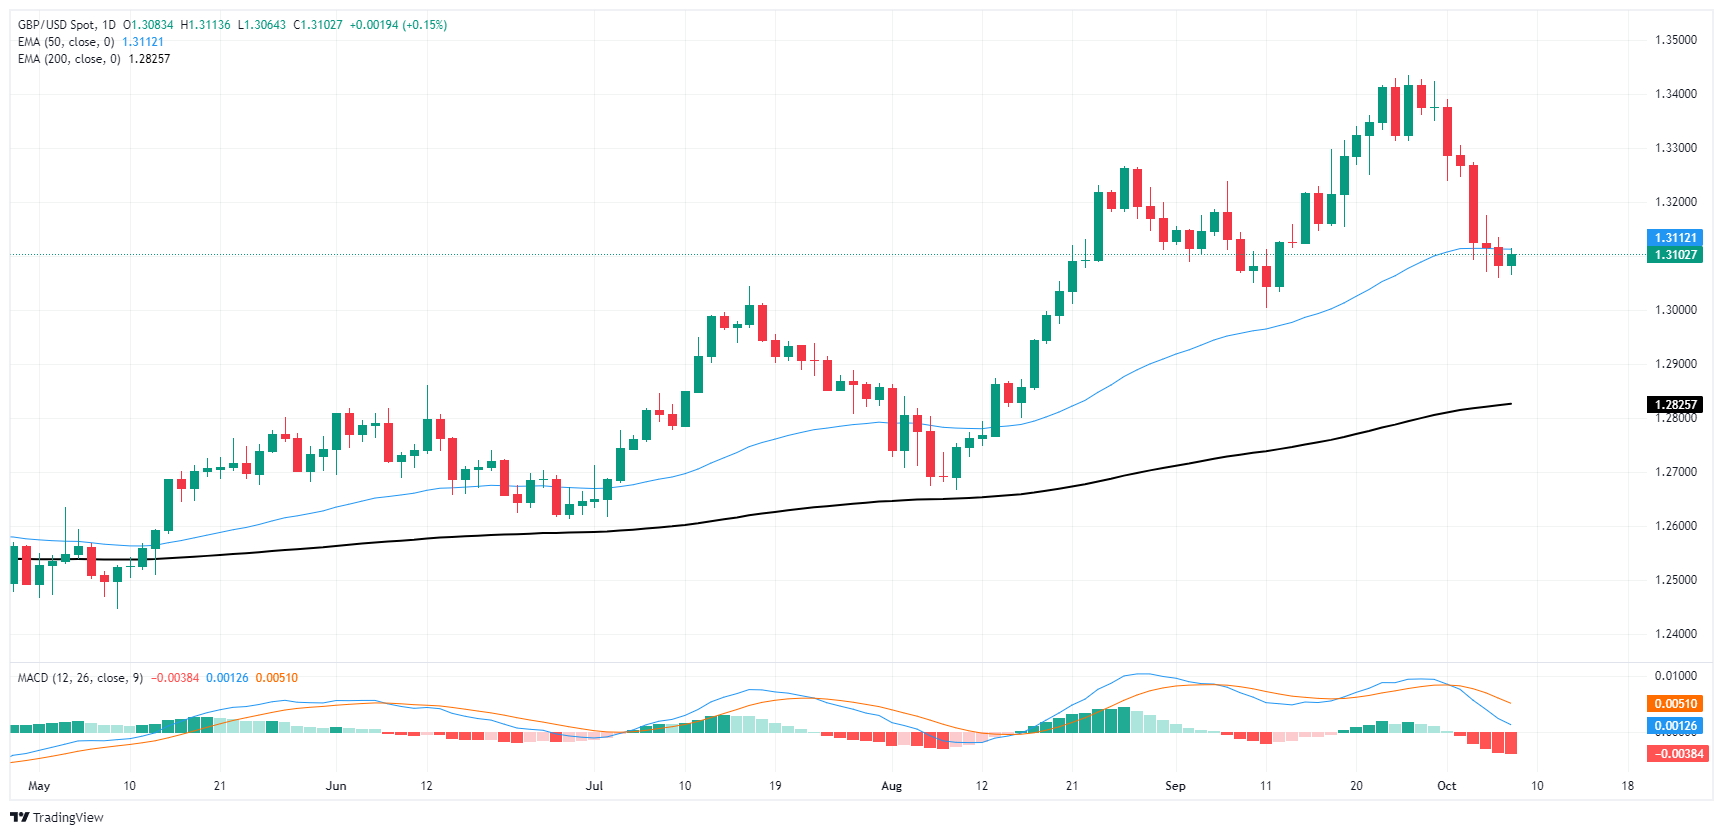
Pound Sterling FAQs
The Pound Sterling (GBP) is the oldest currency in the world (886 AD) and the official currency of the United Kingdom. It is the fourth most traded unit for foreign exchange (FX) in the world, accounting for 12% of all transactions, averaging $630 billion a day, according to 2022 data. Its key trading pairs are GBP/USD, also known as ‘Cable’, which accounts for 11% of FX, GBP/JPY, or the ‘Dragon’ as it is known by traders (3%), and EUR/GBP (2%). The Pound Sterling is issued by the Bank of England (BoE).
The single most important factor influencing the value of the Pound Sterling is monetary policy decided by the Bank of England. The BoE bases its decisions on whether it has achieved its primary goal of “price stability” – a steady inflation rate of around 2%. Its primary tool for achieving this is the adjustment of interest rates. When inflation is too high, the BoE will try to rein it in by raising interest rates, making it more expensive for people and businesses to access credit. This is generally positive for GBP, as higher interest rates make the UK a more attractive place for global investors to park their money. When inflation falls too low it is a sign economic growth is slowing. In this scenario, the BoE will consider lowering interest rates to cheapen credit so businesses will borrow more to invest in growth-generating projects.
Data releases gauge the health of the economy and can impact the value of the Pound Sterling. Indicators such as GDP, Manufacturing and Services PMIs, and employment can all influence the direction of the GBP. A strong economy is good for Sterling. Not only does it attract more foreign investment but it may encourage the BoE to put up interest rates, which will directly strengthen GBP. Otherwise, if economic data is weak, the Pound Sterling is likely to fall.
Another significant data release for the Pound Sterling is the Trade Balance. This indicator measures the difference between what a country earns from its exports and what it spends on imports over a given period. If a country produces highly sought-after exports, its currency will benefit purely from the extra demand created from foreign buyers seeking to purchase these goods. Therefore, a positive net Trade Balance strengthens a currency and vice versa for a negative balance.
Recommended Articles


