Japanese Yen holds mild gains as upbeat GDP data backing further rate hike

Source Fxstreet
  • The Japanese Yen edges higher due to rising odds of the BoJ adopting a hawkish stance amid upbeat GDP data.
  • Japan's Gross Domestic Product increased by 0.8% in Q2, marking the strongest quarterly growth since Q1 of 2023.
  • The US Dollar appreciates due to improved Treasury yields despite rising expectations of the Fed’s rate cut in September.

The Japanese Yen (JPY) gains ground against the US Dollar (USD) on Thursday. This upside occurred as Japan’s Gross Domestic Product (GDP) growth for the second quarter surpassed expectations, supporting the argument for a potential near-term interest rate hike by the Bank of Japan (BoJ).

Japanese Economy Minister Yoshitaka Shindo stated that the economy is anticipated to recover gradually as wages and income improve. Shindo also added that the government will collaborate closely with the Bank of Japan to implement flexible macroeconomic policies.

However, the USD/JPY pair received support from the improved US Dollar amid higher Treasury yields. However, the potential for further gains in the Greenback may be constrained by increasing expectations of at least a 25 basis point rate cut by the US Federal Reserve (Fed) in September.

The moderate US Consumer Price Index (CPI) data has sparked debate about the extent of the Fed’s potential rate cut in September. Traders are favoring a more modest 25 basis point reduction, with a 60% probability, while a 50 basis point cut is still on the table. According to CME FedWatch, there is a 36% chance of the larger cut occurring in September.

Daily Digest Market Movers: Japanese Yen declines despite upbeat GDP data

  • Japan's Gross Domestic Product (GDP) grew by 0.8% quarter-on-quarter in Q2, surpassing market forecasts of 0.5% and rebounding from a 0.6% decline in Q1. This marked the strongest quarterly growth since Q1 of 2023. Meanwhile, the annualized GDP growth reached 3.1%, exceeding the market consensus of 2.1% and reversing a 2.3% contraction in Q1. This was the strongest yearly expansion since Q2 of 2023.
  • Federal Reserve Bank of Chicago President Austan Goolsbee expressed growing concern on Wednesday about the labor market rather than inflation, noting recent improvements in price pressures alongside weak jobs data. Goolsbee added that the extent of rate cuts will be determined by the prevailing economic conditions, per Bloomberg.
  • US headline Consumer Price Index (CPI) rose 2.9% year-over-year in July, slightly down from the 3% increase in June and below market expectations. The Core CPI, which excludes food and energy, climbed 3.2% year-over-year, a slight decrease from the 3.3% rise in June but aligned with market forecasts.
  • Japanese Prime Minister Fumio Kishida announced at a press conference on Wednesday that he will not seek re-election as the leader of the Liberal Democratic Party (LDP) in September. Kishida emphasized the need to combat Japan's deflation-prone economy by promoting wage and investment growth and achieving the goal of expanding Japan's GDP to ¥600 trillion.
  • Rabobank's senior FX strategist, Jane Foley, observes that this week's series of US data releases, along with next week's Jackson Hole event, should provide the market with clearer insights into the potential responses of US policymakers. However, their main expectation is that the Fed will reduce rates by 25 basis points in September and likely cut them again before the end of the year.
  • On Tuesday, Atlanta Fed President Raphael Bostic stated that recent economic data has increased his confidence that the Fed can achieve its 2% inflation target. However, Bostic indicated that additional evidence is required before he would support a reduction in interest rates, according to Reuters.
  • Japan's parliament is scheduled to hold a special session on August 23 to discuss the Bank of Japan's (BoJ) decision to raise interest rates last month. BoJ Governor Kazuo Ueda is expected to attend the session, according to government sources cited by Reuters.
  • The Bank of Japan’s Summary of Opinions from the Monetary Policy Meeting on July 30 and 31 indicated that several members believe economic activity and prices are evolving as expected by the BoJ. They are aiming for a neutral rate of "at least around 1%" as a medium-term target.

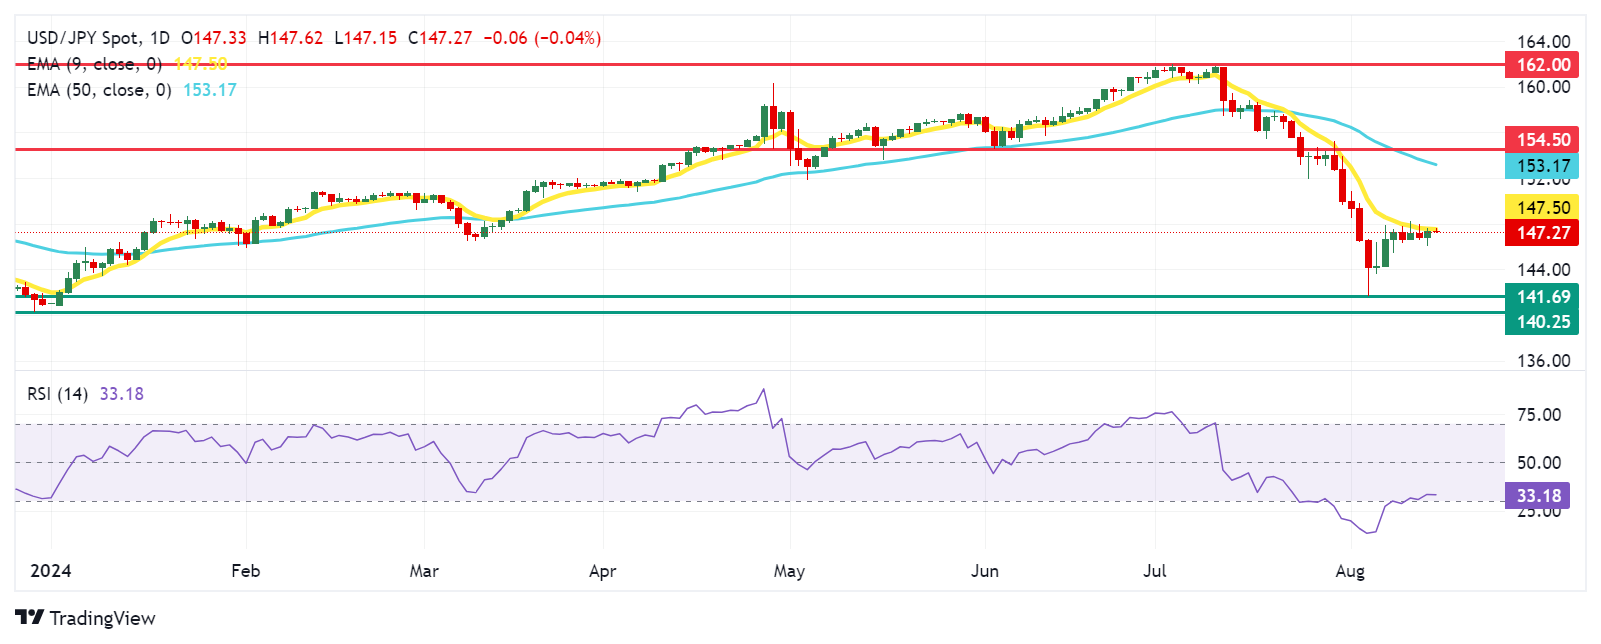
Technical Analysis: USD/JPY holds ground near 147.50 with testing the nine-day EMA barrier

USD/JPY trades around 147.40 on Thursday. The daily chart analysis shows that the pair consolidates within a descending channel, which suggests a bearish bias. Additionally, the 14-day Relative Strength Index (RSI) is positioned slightly above the 30 level, suggesting a potential for a correction.

In terms of support levels, the USD/JPY pair may test the lower boundary of the descending channel around the 142.50 level. A break below this channel could reinforce the bearish bias, potentially driving the pair toward a seven-month low of 141.69, reached on August 5. Further downside could see the pair approaching a secondary support level at 140.25.

On the upside, the USD/JPY pair may encounter immediate resistance at the nine-day Exponential Moving Average (EMA) around the 147.53 level, followed by the upper boundary of the descending channel near 149.00. A breakout above the descending channel could reduce bearish momentum and allow the pair to approach the 50-day EMA at 153.40 level, with the potential to test the resistance level at 154.50, where previous support has now turned into resistance.

USD/JPY: Daily Chart

Japanese Yen PRICE Today

The table below shows the percentage change of Japanese Yen (JPY) against listed major currencies today. Japanese Yen was the strongest against the Swiss Franc.

  USD EUR GBP JPY CAD AUD NZD CHF
USD   0.03% -0.06% -0.03% -0.03% -0.33% 0.03% -0.03%
EUR -0.03%   -0.10% -0.08% -0.05% -0.44% -0.17% -0.06%
GBP 0.06% 0.10%   0.06% 0.05% -0.34% -0.07% 0.14%
JPY 0.03% 0.08% -0.06%   -0.00% -0.33% -0.09% 0.09%
CAD 0.03% 0.05% -0.05% 0.00%   -0.31% -0.12% 0.09%
AUD 0.33% 0.44% 0.34% 0.33% 0.31%   0.26% 0.46%
NZD -0.03% 0.17% 0.07% 0.09% 0.12% -0.26%   0.20%
CHF 0.03% 0.06% -0.14% -0.09% -0.09% -0.46% -0.20%  

The heat map shows percentage changes of major currencies against each other. The base currency is picked from the left column, while the quote currency is picked from the top row. For example, if you pick the Japanese Yen from the left column and move along the horizontal line to the US Dollar, the percentage change displayed in the box will represent JPY (base)/USD (quote).

Bank of Japan FAQs

The Bank of Japan (BoJ) is the Japanese central bank, which sets monetary policy in the country. Its mandate is to issue banknotes and carry out currency and monetary control to ensure price stability, which means an inflation target of around 2%.

The Bank of Japan has embarked in an ultra-loose monetary policy since 2013 in order to stimulate the economy and fuel inflation amid a low-inflationary environment. The bank’s policy is based on Quantitative and Qualitative Easing (QQE), or printing notes to buy assets such as government or corporate bonds to provide liquidity. In 2016, the bank doubled down on its strategy and further loosened policy by first introducing negative interest rates and then directly controlling the yield of its 10-year government bonds.

The Bank’s massive stimulus has caused the Yen to depreciate against its main currency peers. This process has exacerbated more recently due to an increasing policy divergence between the Bank of Japan and other main central banks, which have opted to increase interest rates sharply to fight decades-high levels of inflation. The BoJ’s policy of holding down rates has led to a widening differential with other currencies, dragging down the value of the Yen.

A weaker Yen and the spike in global energy prices have led to an increase in Japanese inflation, which has exceeded the BoJ’s 2% target. With wage inflation becoming a cause of concern, the BoJ looks to move away from ultra loose policy, while trying to avoid slowing the activity too much.

Disclaimer: For information purposes only. Past performance is not indicative of future results.
placeholder
U.S. November Nonfarm Payrolls: What Does the Rare "Weak Jobs, Strong Economy" Mix Mean for U.S. Equities?1. IntroductionAfter retreating from the late-October highs, U.S. equities embarked on a bottoming rebound in mid-to-late November, a trend driven by the interplay of multiple factors. That said, it i
Author  TradingKey
9 hours ago
1. IntroductionAfter retreating from the late-October highs, U.S. equities embarked on a bottoming rebound in mid-to-late November, a trend driven by the interplay of multiple factors. That said, it i
placeholder
Senate Delays Crypto Market Structure Hearings to Early 2026The Senate Banking Committee has postponed cryptocurrency market structure hearings until 2026, citing ongoing bipartisan negotiations.
Author  Mitrade
14 hours ago
The Senate Banking Committee has postponed cryptocurrency market structure hearings until 2026, citing ongoing bipartisan negotiations.
placeholder
Bitcoin Slides 5% as Sellers Lean In — Can BTC Reclaim $88,000?Bitcoin has dropped back below $88,000 after rolling over from $90,500, with price still trading under the 100-hour Simple Moving Average. The sell-off found a floor at $85,151, and BTC is now consolidating near that base, but rebounds are facing pressure from a bearish trend line around $89,000. Bulls need to retake $88,000–$89,000 to ease downside risk; failure to do so keeps $85,500–$85,000 and then $83,500 in play, with $80,000 as the deeper “line in the sand.” Bitcoin (BTC) is back in damage-control mode after a sharp pullback wiped out recent gains. The price failed to reclaim the $90,000–$90,500 band, rolled over, and slid through $88,500 before briefly dipping under $87,000. Buyers did show up around $85,000, but the rebound so far looks more like stabilization than a clear trend reversal. Bitcoin dips hard, finds a bid near $85,000(h3) BTC’s latest move lower began when it couldn’t build follow-through above $90,000 and $90,500. Once that upside stalled, sellers took control and pushed price down through $88,500. The slide accelerated enough to spike below $87,000, but the market didn’t free-fall. Bulls defended the $85,000 zone, printing a low at $85,151. Since then, Bitcoin has been consolidating below the 23.6% Fibonacci retracement of the drop from the $93,560 swing high to the $85,151 low — a clue that the bounce is still shallow and that sellers haven’t fully backed off yet. Structurally, BTC is still on the back foot: It’s trading below $88,000, and It remains below the 100-hour Simple Moving Average, keeping short-term trend pressure pointed downward. Resistance is layered, and $89,000 is the problem area(h3) If bulls try to turn this into a recovery, they’ll have to climb through multiple ceilings in quick succession. First, BTC faces resistance around $87,150, followed by a more meaningful barrier near $87,500. From there, the market’s attention snaps back to $88,000 — the level BTC just lost and now needs to reclaim. A close back above $88,000 would improve the tone, but it doesn’t solve the bigger issue: there’s a bearish trend line on the hourly BTC/USD chart (Kraken feed) with resistance near $89,000, which also lines up with the next technical hurdle. If BTC can push through $89,000 and hold, the rebound could extend toward $90,000, with follow-through targets at $91,000 and $91,500. But until price clears that $88,000–$89,000 zone, rallies are at risk of being sold rather than chased. If BTC fails to reclaim resistance, the downside path is clear(h3) The near-term bear case is simple: if Bitcoin can’t climb back above the $87,000 area and keep traction, sellers may attempt another leg lower. Support levels line up like this: Immediate support: $85,500 First major support: $85,000 Next support: $83,500 Then $82,500 in the near term Below that, the major “don’t break this” level is still $80,000. If BTC slips under $80,000, the risk of acceleration to the downside increases significantly — not because it’s magic, but because it’s the kind of psychological and structural level that tends to trigger forced de-risking. Indicators: momentum still leans bearish(h3) The intraday indicators aren’t offering much comfort yet: Hourly MACD is losing pace in the bearish zone. Hourly RSI remains below 50, suggesting sellers still have the upper hand on short timeframes. So while the $85,000 defense held for now, the market hasn’t flipped bullish — it’s just stopped bleeding.
Author  Mitrade
17 hours ago
Bitcoin has dropped back below $88,000 after rolling over from $90,500, with price still trading under the 100-hour Simple Moving Average. The sell-off found a floor at $85,151, and BTC is now consolidating near that base, but rebounds are facing pressure from a bearish trend line around $89,000. Bulls need to retake $88,000–$89,000 to ease downside risk; failure to do so keeps $85,500–$85,000 and then $83,500 in play, with $80,000 as the deeper “line in the sand.” Bitcoin (BTC) is back in damage-control mode after a sharp pullback wiped out recent gains. The price failed to reclaim the $90,000–$90,500 band, rolled over, and slid through $88,500 before briefly dipping under $87,000. Buyers did show up around $85,000, but the rebound so far looks more like stabilization than a clear trend reversal. Bitcoin dips hard, finds a bid near $85,000(h3) BTC’s latest move lower began when it couldn’t build follow-through above $90,000 and $90,500. Once that upside stalled, sellers took control and pushed price down through $88,500. The slide accelerated enough to spike below $87,000, but the market didn’t free-fall. Bulls defended the $85,000 zone, printing a low at $85,151. Since then, Bitcoin has been consolidating below the 23.6% Fibonacci retracement of the drop from the $93,560 swing high to the $85,151 low — a clue that the bounce is still shallow and that sellers haven’t fully backed off yet. Structurally, BTC is still on the back foot: It’s trading below $88,000, and It remains below the 100-hour Simple Moving Average, keeping short-term trend pressure pointed downward. Resistance is layered, and $89,000 is the problem area(h3) If bulls try to turn this into a recovery, they’ll have to climb through multiple ceilings in quick succession. First, BTC faces resistance around $87,150, followed by a more meaningful barrier near $87,500. From there, the market’s attention snaps back to $88,000 — the level BTC just lost and now needs to reclaim. A close back above $88,000 would improve the tone, but it doesn’t solve the bigger issue: there’s a bearish trend line on the hourly BTC/USD chart (Kraken feed) with resistance near $89,000, which also lines up with the next technical hurdle. If BTC can push through $89,000 and hold, the rebound could extend toward $90,000, with follow-through targets at $91,000 and $91,500. But until price clears that $88,000–$89,000 zone, rallies are at risk of being sold rather than chased. If BTC fails to reclaim resistance, the downside path is clear(h3) The near-term bear case is simple: if Bitcoin can’t climb back above the $87,000 area and keep traction, sellers may attempt another leg lower. Support levels line up like this: Immediate support: $85,500 First major support: $85,000 Next support: $83,500 Then $82,500 in the near term Below that, the major “don’t break this” level is still $80,000. If BTC slips under $80,000, the risk of acceleration to the downside increases significantly — not because it’s magic, but because it’s the kind of psychological and structural level that tends to trigger forced de-risking. Indicators: momentum still leans bearish(h3) The intraday indicators aren’t offering much comfort yet: Hourly MACD is losing pace in the bearish zone. Hourly RSI remains below 50, suggesting sellers still have the upper hand on short timeframes. So while the $85,000 defense held for now, the market hasn’t flipped bullish — it’s just stopped bleeding.
placeholder
AUD/USD remains depressed below mid-0.6600s; downside seems limited ahead of US NFP reportThe AUD/USD pair attracts some sellers for the fourth straight day on Tuesday and trades around the 0.6630 region, down just over 0.10%, during the Asian session.
Author  FXStreet
18 hours ago
The AUD/USD pair attracts some sellers for the fourth straight day on Tuesday and trades around the 0.6630 region, down just over 0.10%, during the Asian session.
placeholder
Macro Analysts: Hawkish Japan Could Push Bitcoin Below $70KAnalysts predict Bitcoin may face further declines towards the $70,000 mark if the Bank of Japan raises interest rates as expected.
Author  Mitrade
Yesterday 05: 48
Analysts predict Bitcoin may face further declines towards the $70,000 mark if the Bank of Japan raises interest rates as expected.
goTop
quote