AUD/JPY Price Analysis: Bearish bias subdued, indicators hint at consolidation phase

Source Fxstreet
  • The AUD/JPY pair declined to 96.45 on Friday resuming the losses after three sessions with gains.
  • However, technical indicators suggest a shift towards neutral territory, with the RSI moving out of the oversold zone and the MACD showing decreasing red bars.
  • The cross will close a weekly gain of nearly 1% despite the losses.

In Friday's session, the AUD/JPY pair declined by 0.65% to 96.45, extending its recent downward trajectory. Despite this move lower, technical indicators are showing signs of a potential shift in market sentiment.

The Relative Strength Index (RSI) has moved out of the oversold territory below 30 and is currently hovering around 33. This suggests that the AUD/JPY is no longer considered oversold and is moving towards neutral ground. The Moving Average Convergence Divergence (MACD) is also showing decreasing red bars, indicating that the bearish momentum may be waning.

AUD/JPY daily chart

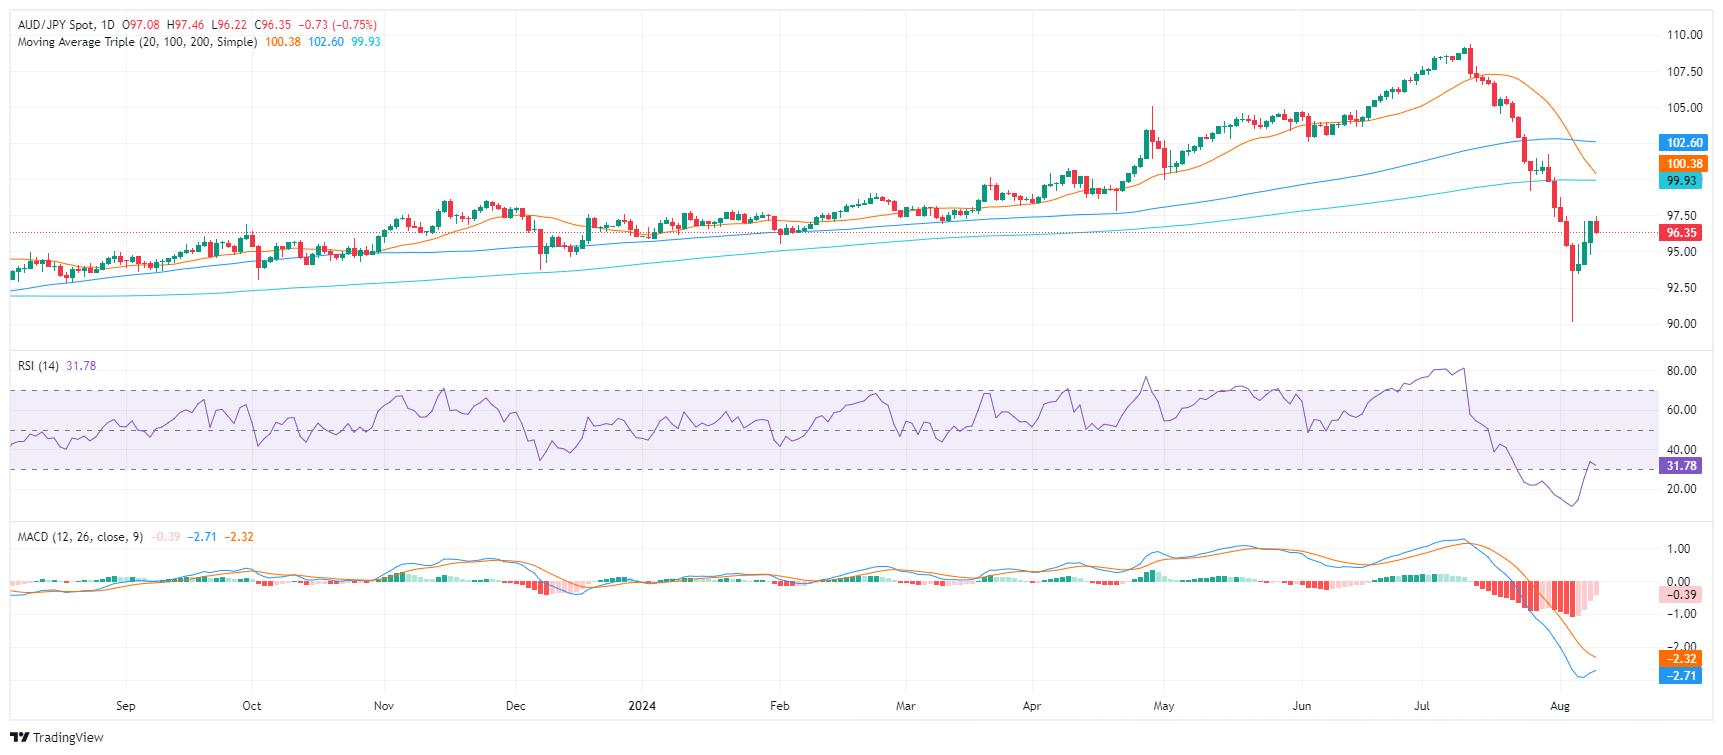
Based on these technical observations, it is possible that the AUD/JPY pair is entering a consolidation phase. The pair may continue to trade within a range, with limited downside potential due to the increasing support at 96.00 and 95.00. On the upside, resistance at 97.00, 98.00, and 100.00 could limit any significant upward movement.

Disclaimer: For information purposes only. Past performance is not indicative of future results.
placeholder
Nearly $2 Billion Wiped Out in Crypto Liquidations Amid Brutal Sell-OffThe crypto market experienced nearly $2 billion in liquidations over the past 24 hours, as the total market capitalization dropped below $3 trillion for the first time in five months.Bitcoin (BTC) alo
Author  Beincrypto
Yesterday 10: 24
The crypto market experienced nearly $2 billion in liquidations over the past 24 hours, as the total market capitalization dropped below $3 trillion for the first time in five months.Bitcoin (BTC) alo
placeholder
Market Meltdown: BTC, ETH, and XRP Capitulate as Bears Seize ControlBitcoin trades around $85,900 after breaking below $86,000, with Ethereum under $2,791 and XRP below $1.99 as BTC, ETH and XRP extend weekly losses of 8–10%, forcing traders to focus on supports at $85,000, $2,749 and $1.77 for clues on whether this sell-off has further to run.
Author  Mitrade
Yesterday 04: 15
Bitcoin trades around $85,900 after breaking below $86,000, with Ethereum under $2,791 and XRP below $1.99 as BTC, ETH and XRP extend weekly losses of 8–10%, forcing traders to focus on supports at $85,000, $2,749 and $1.77 for clues on whether this sell-off has further to run.
placeholder
Bitcoin's Drop to $86K Approaches 'Max Pain' Zone, Yet Presents Potential Buying OpportunityAnalysts identify the $84,000 to $73,000 range as Bitcoin's likely "max pain" territory where capitulation may occur.
Author  Mitrade
Yesterday 03: 35
Analysts identify the $84,000 to $73,000 range as Bitcoin's likely "max pain" territory where capitulation may occur.
placeholder
Whale Dump Meets Quantum Panic: Bitcoin Slips to $86,000 and Blows $220 Million LongsBitcoin fell below $87,000 on November 20, 2025, amid a storm of quantum security fears and $1.3 billion whale capitulation. In the process, it blew almost $220 million in long positions out of the wa
Author  Beincrypto
Yesterday 03: 11
Bitcoin fell below $87,000 on November 20, 2025, amid a storm of quantum security fears and $1.3 billion whale capitulation. In the process, it blew almost $220 million in long positions out of the wa
placeholder
EUR/USD dives further as traders pare back Fed cuts betsEUR/USD extends losses for the fifth consecutive day and trades at 1.1520 at the time of writing on Thursday after a sharp reversal from levels near 1.1600 on Wednesday.
Author  FXStreet
Nov 20, Thu
EUR/USD extends losses for the fifth consecutive day and trades at 1.1520 at the time of writing on Thursday after a sharp reversal from levels near 1.1600 on Wednesday.
goTop
quote