USD/CAD Price Analysis: Rising within range as Canadian Dollar weakens

Source Fxstreet
  • USD/CAD starts fresh leg higher within a multi-month range and is poised to continue rising. 
  • The Canadian Dollar is weakening and USD/CAD has broken above all key Moving Averages.
     

USD/CAD looks to be starting a leg higher within a range that began unfolding in May. 

The pair’s lack of directionality means the short-term trend is sideways and given the “trend is your friend” the odds favor more ups and downs to come. 

USD/CAD 4-hour Chart 

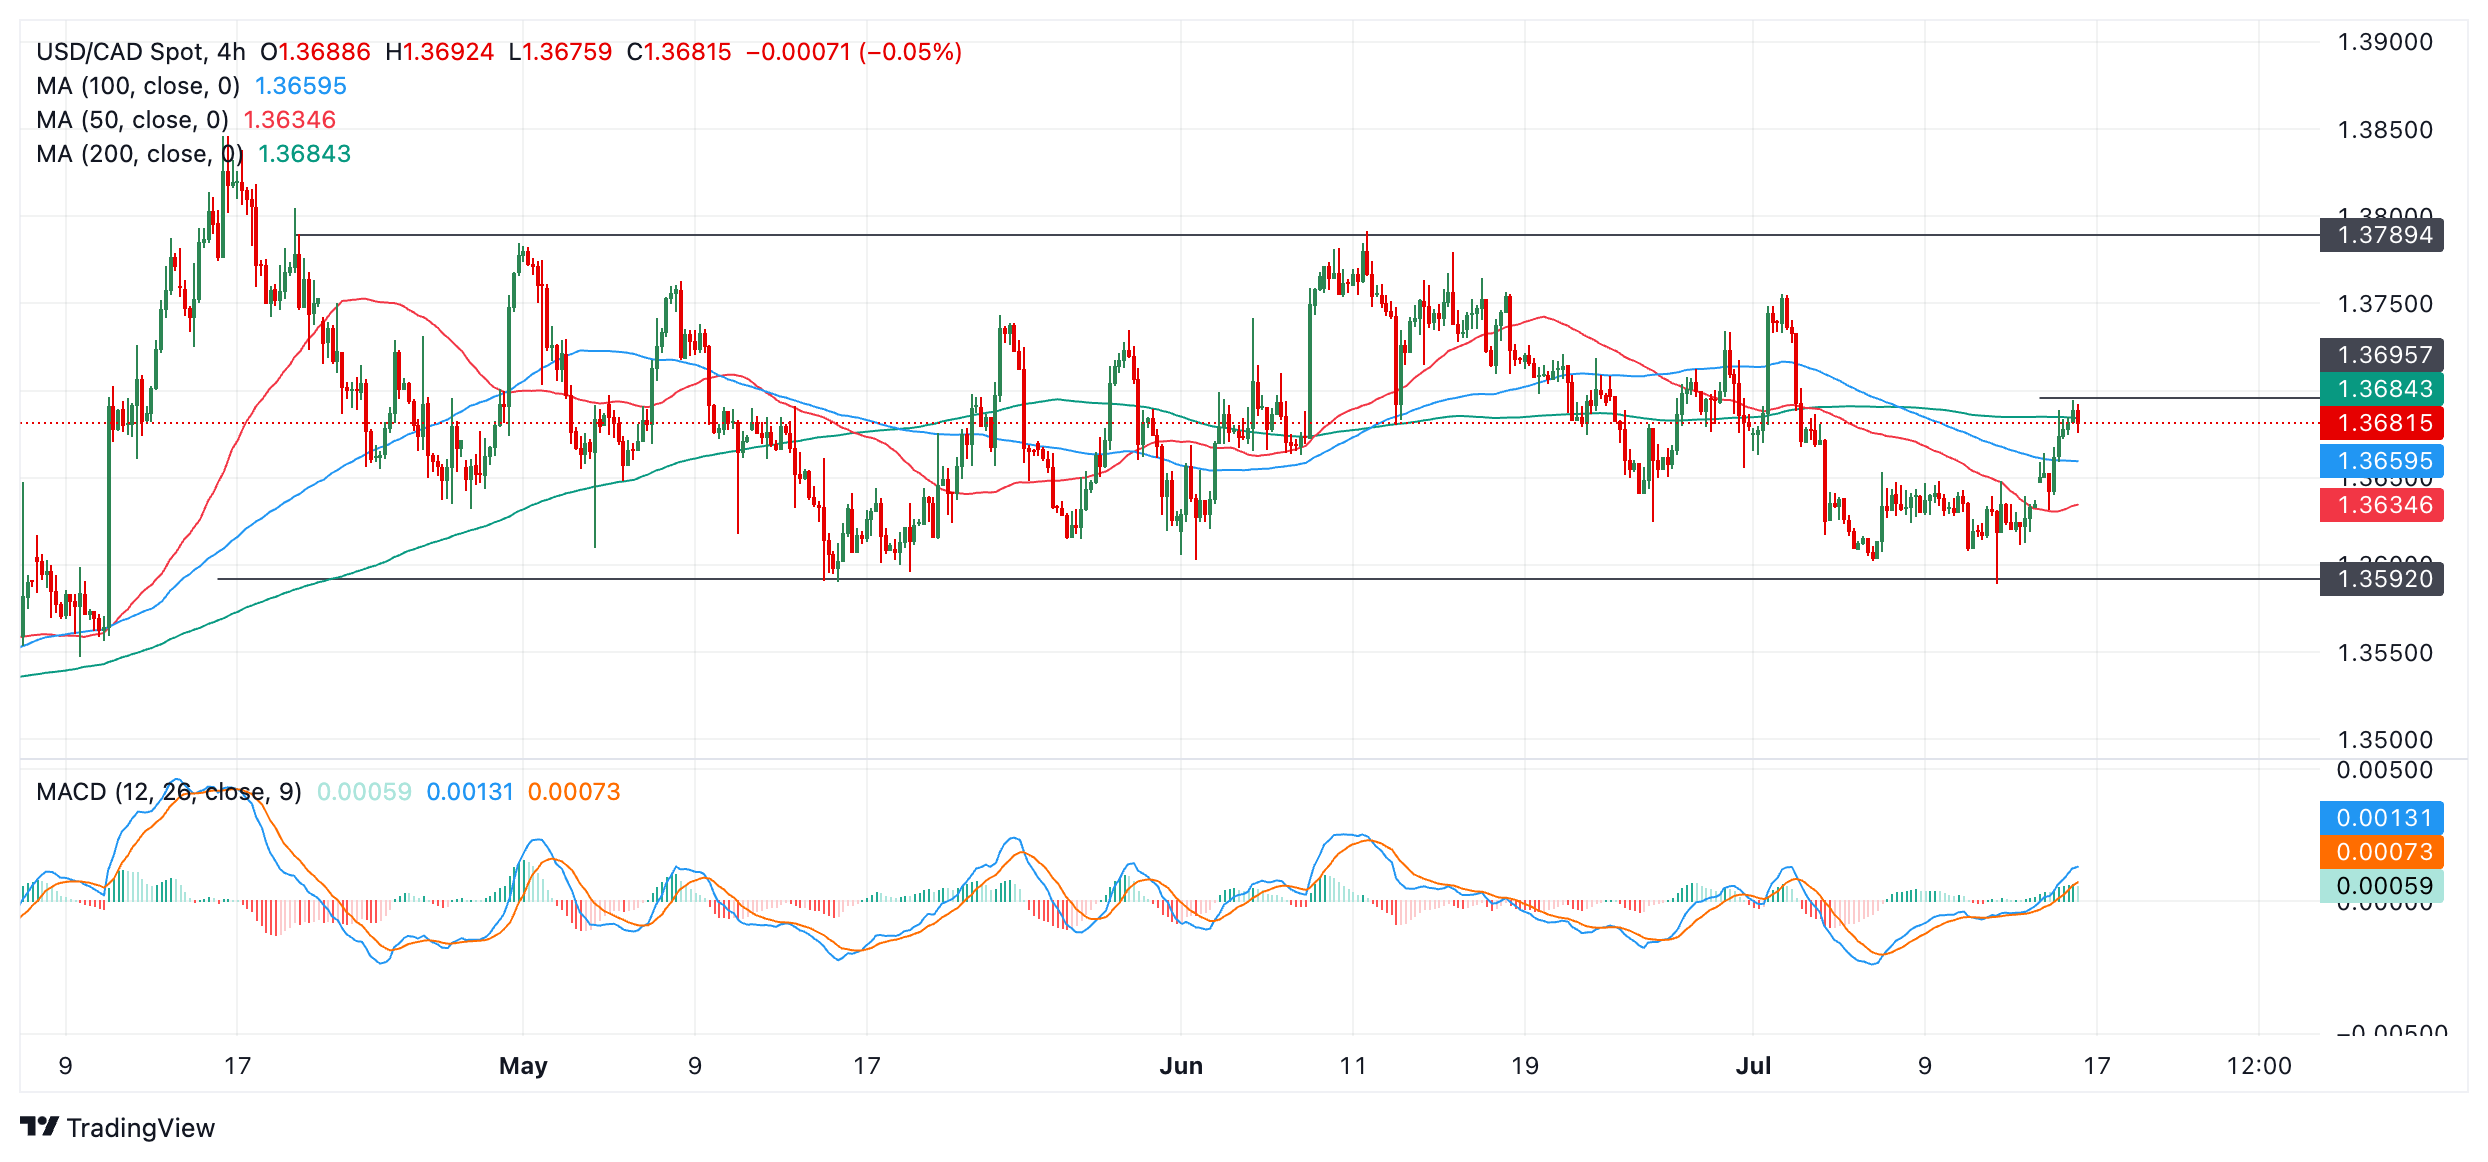
Currently the pair appears to be in the process of rising towards the 1.3788 ceiling as the Canadian Dollar (CAD) undergoes a period of weakening. It has broken above all three major Simple Moving Averages (SMA) – another bullish sign. A break above 1.3695 would confirm further upside. 

The Moving Average Convergence Divergence (MACD) indicator crossed above its red signal line on July 5 after the initial bounce and is rising towards the zero line. This corroborates the view that an up leg is evolving. Crosses of the MACD above and below its signal line have coincided with most of the turns within the range so far, suggesting it has been a particularly reliable indicator. 


Disclaimer: For information purposes only. Past performance is not indicative of future results.
placeholder
Nvidia Q1 Revenue Surges 85%, Data Center Business Accounts for 90%, Blowout Results Fail to Stop Stock VolatilityAs the absolute leader in the global AI industry chain, NVIDIA ( NVDA) delivered a quarterly earnings report that surpassed Wall Street's general expectations as anticipated.After the mar
Author  TradingKey
9 hours ago
As the absolute leader in the global AI industry chain, NVIDIA ( NVDA) delivered a quarterly earnings report that surpassed Wall Street's general expectations as anticipated.After the mar
placeholder
Is US-Iran Conflict About to End? Crude Oil Plummets, Gold Hits $4,500Tensions between the US and Iran showed clear signs of easing on Wednesday (May 20), leading to a plunge in the crude oil market while gold ( XAUUSD) continued its rally.WTI crude oil dai
Author  TradingKey
12 hours ago
Tensions between the US and Iran showed clear signs of easing on Wednesday (May 20), leading to a plunge in the crude oil market while gold ( XAUUSD) continued its rally.WTI crude oil dai
placeholder
Gold holds steady near $4,550 as market eyes Middle East developmentsGold price (XAU/USD) trades on a flat note around $4,540 during the early Asian session on Thursday. Traders continue to assess the developments surrounding stalled US-Iran peace negotiations and threats to the Strait of Hormuz.
Author  FXStreet
16 hours ago
Gold price (XAU/USD) trades on a flat note around $4,540 during the early Asian session on Thursday. Traders continue to assess the developments surrounding stalled US-Iran peace negotiations and threats to the Strait of Hormuz.
placeholder
Nvidia Earnings Approach: Can It Drive a Nasdaq Rebound? What Should Investors Watch Most?On May 20, ET, NVIDIA ( NVDA )'s first-quarter fiscal 2026 earnings report, to be released after the market close, has become the market focus. The options market has already reacted; bas
Author  TradingKey
Yesterday 10: 33
On May 20, ET, NVIDIA ( NVDA )'s first-quarter fiscal 2026 earnings report, to be released after the market close, has become the market focus. The options market has already reacted; bas
placeholder
Gold Prices Fall Below Key $4,500 Mark, US Treasury Yields Rise for Seventh Day, Gold May Fall to $4,100On Tuesday (May 19), gold ( XAUUSD) closed at $4,481.89. The price confirmed a break below $4,500, further opening up the downside. On Wednesday, gold extended its downward trend from the
Author  TradingKey
Yesterday 03: 34
On Tuesday (May 19), gold ( XAUUSD) closed at $4,481.89. The price confirmed a break below $4,500, further opening up the downside. On Wednesday, gold extended its downward trend from the
Related Instrument
goTop
quote