

The US Dollar holds the yield advantage: Why safe-haven demand still sank it against the Japanese Yen

Source Fxstreet

The US Dollar (USD) has experienced a sharp setback against the Japanese Yen (JPY), with USD/JPY plunging from the 158.20 area to intraday lows around 156.08 as falling US Treasury yields and a spike in geopolitical risk aversion triggered aggressive safe-haven demand for the Yen. While the US Dollar continues to hold broad-based yield advantages across most major currency pairs, its momentum against the JPY is facing headwinds from hotter Japanese inflation metrics and solid private sector growth. Institutional strategists at UOB and BBH are evaluating whether this steep oversold decline represents a temporary tactical pullback within a broader 155.00–160.00 trading range or the start of a deeper structural unwinding.
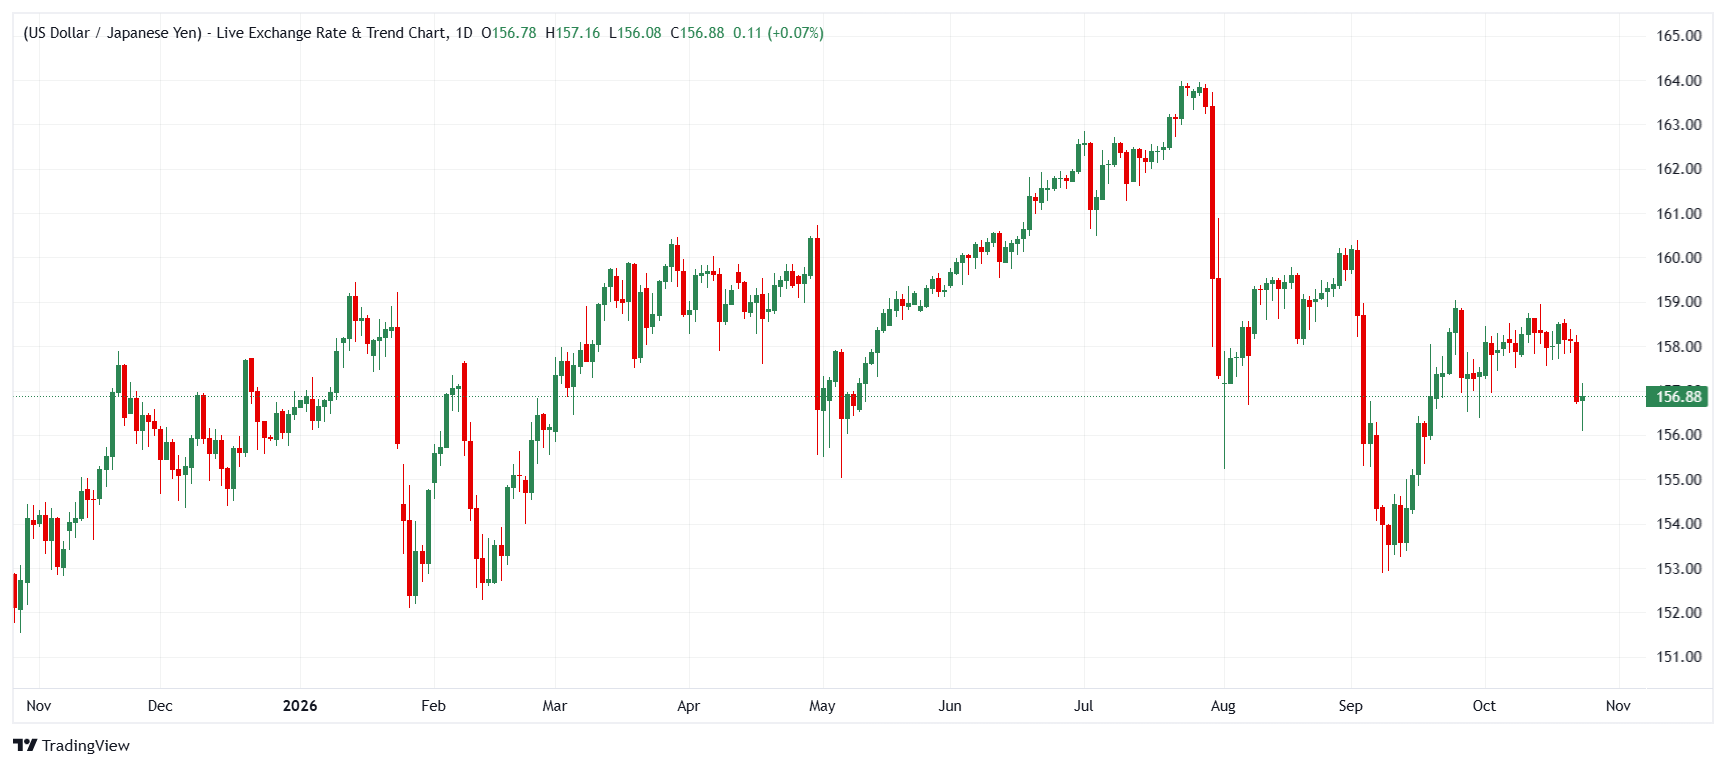
USD/JPY daily chart
USD/JPY daily chart

UOB sees downside momentum pushing USD/JPY toward 156.00 and 155.50

Quek Ser Leang and Lee Sue Ann at UOB highlight the sudden acceleration in USD/JPY downside momentum, which broke the pair out of its recent 157.70–158.80 consolidation zone down to 156.67. Although technical indicators are deeply oversold in the short term, they expect the USD/JPY to extend its decline toward 156.00 before stabilizing, with strong resistance now lowered to 157.30.

"In a sudden sharp move, USD plunged to a low of 156.67. The rapid increase in downward momentum suggests USD is likely to decline further. Support levels are 156.00 and 155.50. On the upside, a break above 157.80 would mean that USD is not declining further... While deeply oversold, the decline could extend to 156.00 before stabilisation can be expected."

BBH expects JPY safe-haven inflows to anchor USD/JPY within 155.00–160.00 range

Elias Haddad at Brown Brothers Harriman (BBH) highlights that the Japanese Yen is leading global currency gains as investors seek refuge during market volatility. While hotter Japanese inflation metrics (2.4% core CPI) and resilient PMI data (52.3) bolster the long-term case for BoJ rate hikes, low market expectations for an October rate move (2% odds) mean USD/JPY should hold inside a defined 155.00–160.00 range unless risk-off sentiment intensifies.

"JPY leads gains, underscoring its status as the ultimate refuge currency. Japan September CPI and October PMI back additional BOJ hikes... Nonetheless, the BOJ is unlikely to crank up the pace of tightening with headline and core CPI inflation tracking below its 2026 projection of 2.5%. The swaps curve price in just 2% odds of a 25bps BOJ rate hike to 1.50% on October 30, and 80% probability of a hike on December 18... That leaves USD/JPY likely to trade within a 155.00-160.00 range in the near term."

Key Takeaway

The sharp drop in USD/JPY toward 156.08 demonstrates that while the US Dollar retains overall macro dominance, it remains vulnerable to sudden surges in JPY safe-haven demand and lower US Treasury yields. While UOB warns that technical momentum could drive the USD/JPY lower toward 156.00 and 155.50 near term, BBH stresses that with Bank of Japan tightening expectations largely pushed back to December (80% probability), the pair should find solid structural support within a broader 155.00–160.00 trading corridor.


(This article was created with the help of an Artificial Intelligence tool and reviewed by an editor. Know more.)

Disclaimer: For information purposes only. Past performance is not indicative of future results.
placeholder
Gold Faces Pressure Ahead of Fed Decision as Prices Extend Drop Below $4,000 As of the Asian session on October 23, gold prices (XAUUSD) continued Thursday's decline, dipping below the $4,000 mark during intraday trading to hit a low of $3,986.54. On Thursday, gol
Author  TradingKey
13 hours ago
As of the Asian session on October 23, gold prices (XAUUSD) continued Thursday's decline, dipping below the $4,000 mark during intraday trading to hit a low of $3,986.54. On Thursday, gol
placeholder
Nasdaq closes at 26,008.86 — 8.9 points above 26,000, and the credit market never blinkedThe Nasdaq Composite fell 2.60% to 26,008.86 on October 22, its worst session since June, as Meta sank 6.98% on 2026 capex guidance of $135–145 billion. But the equal-weight S&P 500 rose 0.73%, high-yield credit was flat and 10-year yields fell 20 basis points. This was an AI de-rating, not a risk-off event — here is the transmission chain, the 29,000 / 28,200 levels and what would prove it wrong.
Author  Irene Q.
15 hours ago
The Nasdaq Composite fell 2.60% to 26,008.86 on October 22, its worst session since June, as Meta sank 6.98% on 2026 capex guidance of $135–145 billion. But the equal-weight S&P 500 rose 0.73%, high-yield credit was flat and 10-year yields fell 20 basis points. This was an AI de-rating, not a risk-off event — here is the transmission chain, the 29,000 / 28,200 levels and what would prove it wrong.
placeholder
Brent tops $113 on Saudi supply risk — but the diesel line in the EIA report is the tellBrent's December contract settled at $113.17 on October 22, up 4.00% and the highest close since May 4, after Saudi Arabia restricted refined-product shipments. The same session's EIA report showed crude stocks down 3.06 million barrels and gasoline down 2.95 million — but distillates built 1.68 million. That single line decides whether $113 holds: here are the data, the 108.8 / 114.0 / 119.3 levels and the two scenarios.
Author  Irene Q.
15 hours ago
Brent's December contract settled at $113.17 on October 22, up 4.00% and the highest close since May 4, after Saudi Arabia restricted refined-product shipments. The same session's EIA report showed crude stocks down 3.06 million barrels and gasoline down 2.95 million — but distillates built 1.68 million. That single line decides whether $113 holds: here are the data, the 108.8 / 114.0 / 119.3 levels and the two scenarios.
placeholder
Gold Price Analysis Today | Forex Gold Analysis | XAU/USD Analysis - October 23, 2026Get the latest gold price analysis, forex gold insights, and XAU/USD analysis for October 23, 2026. Read on for the details.
Author  Mitrade
18 hours ago
Get the latest gold price analysis, forex gold insights, and XAU/USD analysis for October 23, 2026. Read on for the details.
placeholder
Gold falls to two‑month low below $4,050 as oil spikesGold price (XAU/USD) falls to the lowest in more than two months near $4,025 during the early Asian session on Friday. The precious metal faces some selling pressure as escalating tensions in the Middle East send oil surging ahead of a Federal Reserve (Fed) policy meeting.
Author  FXStreet
20 hours ago
Gold price (XAU/USD) falls to the lowest in more than two months near $4,025 during the early Asian session on Friday. The precious metal faces some selling pressure as escalating tensions in the Middle East send oil surging ahead of a Federal Reserve (Fed) policy meeting.
Related Instrument
goTop
quote