

GBP/USD Price Forecast: British Pound to remain volatile in heavy UK data week

Source Fxstreet
  • The British Pound ticks lower against the US Dollar as the latter rises.
  • Investors keenly await the UK labor market and inflation data.
  • Elevated French bond yields have lend support to the US Dollar.

The British Pound (GBP) trades marginally lower at around 1.3314 against the US Dollar (USD) during the European trading session on Monday, but is wobbling inside Friday’s trading range. The GBP/USD pair is expected to remain sideways as investors await key United Kingdom (UK) employment data for quarter ending August and the Consumer Price Index (CPI) data for September, which are scheduled for Tuesday and Wednesday, respectively.

According to estimates, the ILO Unemployment Rate increased to 5% from 4.9% in three months ending July. Average Earnings Including Bonuses drops to 3.8% Year-on-Year (YoY) from the previous reading of 3.9%.

Economists at Deutsche Bank expect UK price pressures to re-accelerate into September, projecting that inflation will “push to its highest rate all year.” They look for headline CPI to rise to “3.49% y-o-y, with core CPI pushing to 2.74% y-o-y.” Within the basket, Deutsche Bank also anticipates a renewed pickup in services, with “Services CPI, we expect, will also rise, picking up pace to 3.71% y-o-y on stronger base effects.”

The UK data will likely have a significant impact on Bank of England’s (BoE) interest rate expectations.

Meanwhile, the US Dollar trades higher as social protests in France amid higher cost of living have boosted borrowing costs for government. 10-year French bond yields holds onto Friday’s gains at around 4.87%.

GBP/USD Technical Analysis
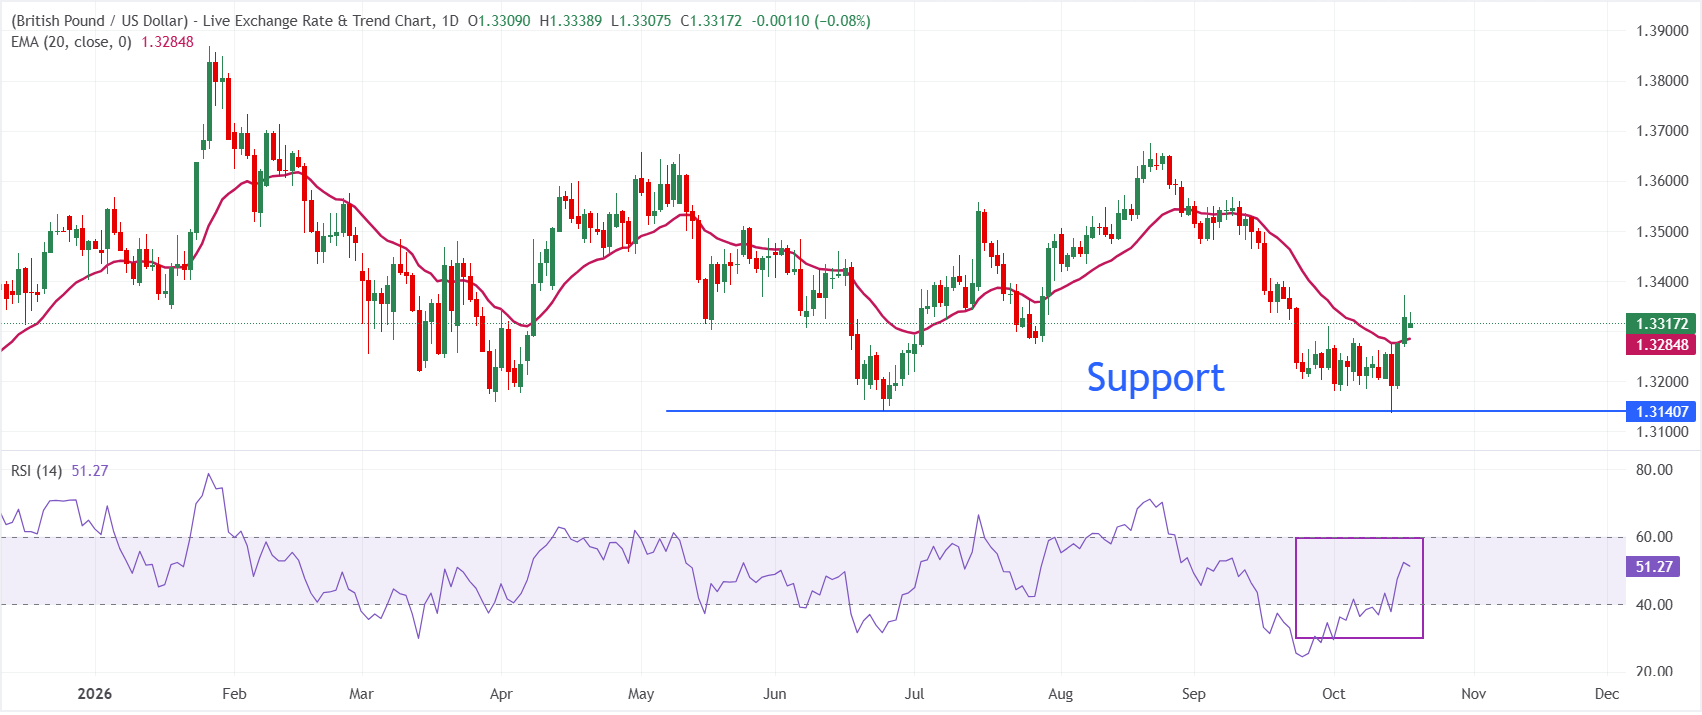
In the daily chart, GBP/USD trades at 1.3317, holding a mildly bullish near-term tone as spot remains above the 20-day exponential moving average (EMA) at 1.3285. The short-term trend bias is underpinned by this nearby dynamic support, while the Relative Strength Index (14) around 51 suggests neutral-to-positive momentum rather than overextension in either direction.

On the downside, initial support is located at the 20-day EMA near 1.3285, while the major support lies at 1.3140. On the upside, the Friday's high at 1.3372 seems the key hurdle for the pair.

(The technical analysis of this story was written with the help of an AI tool. Know more.)

Economic Indicator

Consumer Price Index (YoY)

The United Kingdom (UK) Consumer Price Index (CPI), released by the Office for National Statistics on a monthly basis, is a measure of consumer price inflation – the rate at which the prices of goods and services bought by households rise or fall – produced to international standards. It is the inflation measure used in the government’s target. The YoY reading compares prices in the reference month to a year earlier. Generally, a high reading is seen as bullish for the Pound Sterling (GBP), while a low reading is seen as bearish.

Read more.

Next release: Wed Oct 21, 2026 06:00

Frequency: Monthly

Consensus: 3.4%

Previous: 3.1%

Source: Office for National Statistics

The Bank of England is tasked with keeping inflation, as measured by the headline Consumer Price Index (CPI) at around 2%, giving the monthly release its importance. An increase in inflation implies a quicker and sooner increase of interest rates or the reduction of bond-buying by the BOE, which means squeezing the supply of pounds. Conversely, a drop in the pace of price rises indicates looser monetary policy. A higher-than-expected result tends to be GBP bullish.

Disclaimer: For information purposes only. Past performance is not indicative of future results.
placeholder
Brent Crude Oil Price Forecast: Trump Eases Sanctions on Russia, Oil Prices Under Pressure Below $110, Can They Still Rise?On Monday (October 19), Brent (UKOIL) crude oil prices fell noticeably at the open today after a sharp rally last Friday. As of press time, oil prices were down about 2.1%, trading near $
Author  TradingKey
10 hours ago
On Monday (October 19), Brent (UKOIL) crude oil prices fell noticeably at the open today after a sharp rally last Friday. As of press time, oil prices were down about 2.1%, trading near $
placeholder
Bitcoin's double top at $88,000: why $78,000 is the line that decides the next moveBitcoin trades near $82,500 (+0.47%) after twice failing at the $88,000 area, forming a potential double top with a neckline at $78,000. A break below the neckline would project a measured target near $68,200; a close back above $88,000 would invalidate the pattern. Here are the structure, the levels and what would confirm either side.
Author  Suzie
14 hours ago
Bitcoin trades near $82,500 (+0.47%) after twice failing at the $88,000 area, forming a potential double top with a neckline at $78,000. A break below the neckline would project a measured target near $68,200; a close back above $88,000 would invalidate the pattern. Here are the structure, the levels and what would confirm either side.
placeholder
Brent slips from $110 as Russian supply prospects return — is the five-month rally over?Brent crude traded near $108.06 on Monday (-1.71%), pulling back from last week's $110 high after Washington moved to ease restrictions on Russian oil flows. WTI hovered around $101 before dipping below $99. The retreat is real, but so is the supply-risk premium: Hormuz shipping disruptions, attacks on Saudi energy infrastructure and strikes on Russian refineries remain live. Here are the three numbers, the transmission chain and the levels that matter.
Author  Irene Q.
15 hours ago
Brent crude traded near $108.06 on Monday (-1.71%), pulling back from last week's $110 high after Washington moved to ease restrictions on Russian oil flows. WTI hovered around $101 before dipping below $99. The retreat is real, but so is the supply-risk premium: Hormuz shipping disruptions, attacks on Saudi energy infrastructure and strikes on Russian refineries remain live. Here are the three numbers, the transmission chain and the levels that matter.
placeholder
Gold retests $4,200 as dollar and yields retreat — can bullion clear its hardest level?Spot gold traded near $4,175 on Monday (+0.23%), with an intraday high of $4,187.71 after last week's $4,073 ~ $4,217 range; COMEX futures briefly topped $4,200. The dollar slipped to 101.76 and 10-year yields eased from their highs, but October Fed hike odds near 52% and BofA's sub-$4,000 call still cap the upside. Here are the drivers, the levels and what would flip the script.
Author  Irene Q.
15 hours ago
Spot gold traded near $4,175 on Monday (+0.23%), with an intraday high of $4,187.71 after last week's $4,073 ~ $4,217 range; COMEX futures briefly topped $4,200. The dollar slipped to 101.76 and 10-year yields eased from their highs, but October Fed hike odds near 52% and BofA's sub-$4,000 call still cap the upside. Here are the drivers, the levels and what would flip the script.
placeholder
Gold Price Analysis Today | Forex Gold Analysis | XAU/USD Analysis - October 19, 2026Get the latest gold price analysis, forex gold insights, and XAU/USD analysis for October 19, 2026. Read on for the details.
Author  Mitrade
19 hours ago
Get the latest gold price analysis, forex gold insights, and XAU/USD analysis for October 19, 2026. Read on for the details.
goTop
quote