


AUD/USD Price Forecast: Faces selling pressure due to weak Australian employment data
- The Australian Dollar trades lower due to weak Aussie employment data for September.
- Market experts turn doubtful over hawkish RBA expectations for the November meeting.
- AUD/USD forms a Head and Shoulders pattern, signaling fresh downside leg ahead.
The Australian Dollar (AUD) underperforms its major currency peers on Thursday as weak employment data for September has clouded expectations of an interest rate hike by the Reserve Bank of Australia (RBA) this year. Against the US Dollar, the Australian currency is down 0.7% to near 0.6920 in the European trade.
Australian Dollar Price Today
The table below shows the percentage change of Australian Dollar (AUD) against listed major currencies today. Australian Dollar was the weakest against the Swiss Franc.
| USD | EUR | GBP | JPY | CAD | AUD | NZD | CHF | |
|---|---|---|---|---|---|---|---|---|
| USD | -0.53% | -0.47% | -0.32% | -0.29% | 0.74% | -0.32% | -0.59% | |
| EUR | 0.53% | 0.05% | 0.21% | 0.22% | 1.30% | 0.19% | -0.05% | |
| GBP | 0.47% | -0.05% | 0.17% | 0.16% | 1.21% | 0.14% | -0.12% | |
| JPY | 0.32% | -0.21% | -0.17% | -0.01% | 1.06% | -0.05% | -0.29% | |
| CAD | 0.29% | -0.22% | -0.16% | 0.00% | 1.04% | -0.02% | -0.29% | |
| AUD | -0.74% | -1.30% | -1.21% | -1.06% | -1.04% | -1.05% | -1.30% | |
| NZD | 0.32% | -0.19% | -0.14% | 0.05% | 0.02% | 1.05% | -0.28% | |
| CHF | 0.59% | 0.05% | 0.12% | 0.29% | 0.29% | 1.30% | 0.28% |
The heat map shows percentage changes of major currencies against each other. The base currency is picked from the left column, while the quote currency is picked from the top row. For example, if you pick the Australian Dollar from the left column and move along the horizontal line to the US Dollar, the percentage change displayed in the box will represent AUD (base)/USD (quote).
Analysts at Rabobank highlight a weaker tone in Australia’s latest labour figures, noting that “the unemployment rate printing at 4.6% and a contraction of almost 40 thousand jobs” is effectively “erasing the job gains seen in July.”
Rabobank added, “The bank characterises the September data as setting a softer backdrop for policy discussions, with the labour market losing momentum after earlier gains.”
Strategists at ANZ have also said that weaker labour market data made another rate increase less likely; however, they have maintained their forecast for a further 25-basis-point hike in November. The bank added that the RBA’s decision would depend on developments in both “economic activity and inflation”, Reuters reported.
Meanwhile, the US Dollar is also under pressure ahead of the United States (US) Producer Price Index (PPI) for September, which will be published at 12:30 GMT.
AUD/USD Technical Analysis
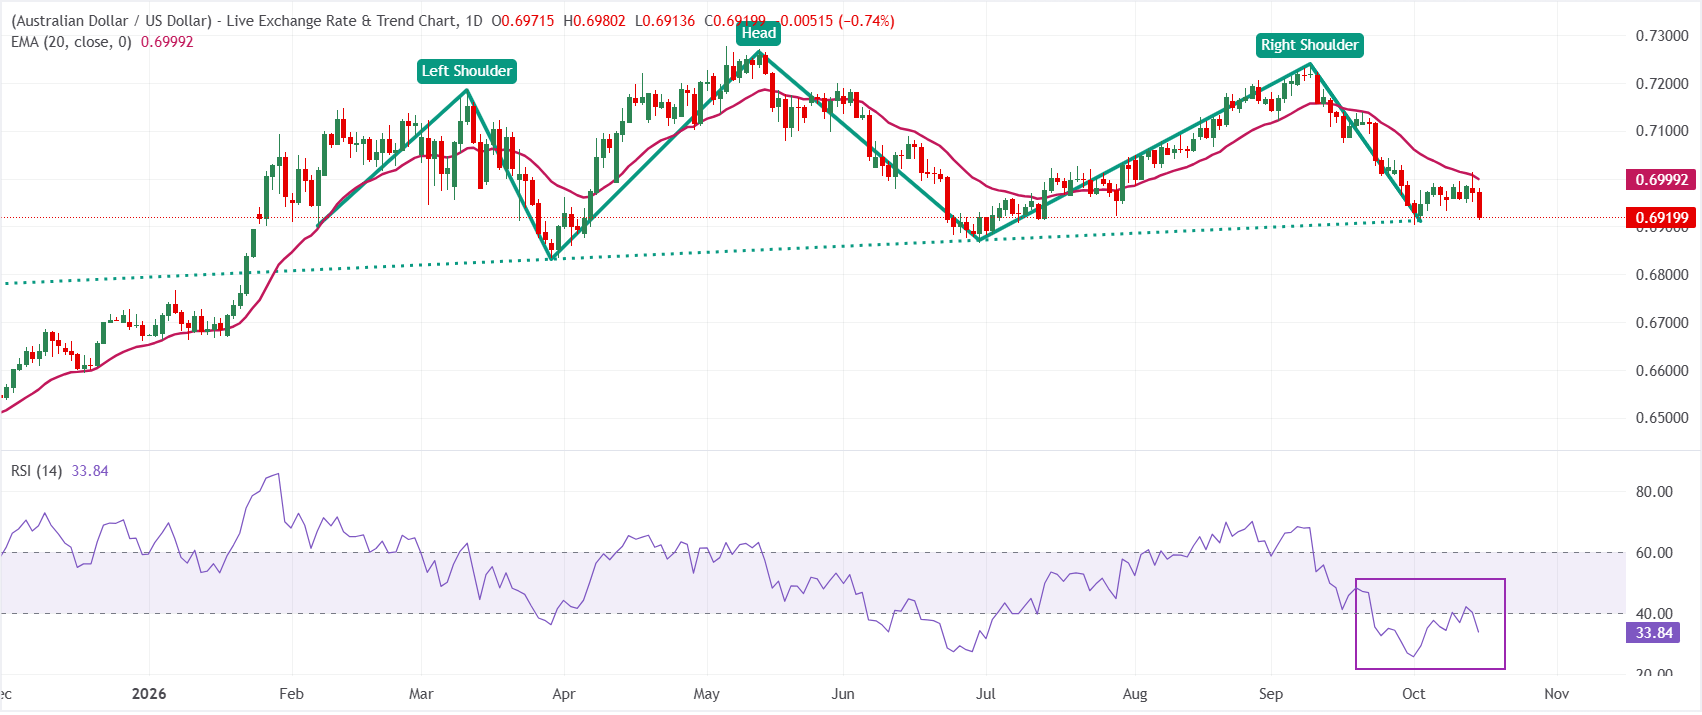
Trend: On the daily chart, AUD/USD trades at 0.6920 with a bearish near-term bias, as spot holds below the 20-period Exponential Moving Average (EMA) at 0.6999. The Head and Shoulders (H&S) formation also builds the case for a bearish bias.
Momentum: The Relative Strength Index (RSI) around 34 sits just above oversold territory, hinting at stretched downside but not yet signaling a decisive reversal.
Resistance: On the topside, immediate resistance is located at the 20-day EMA at 0.6999, which caps recovery attempts and defines the first hurdle for any corrective bounce.
Support: On the downside, the Aussie pair could enter a fresh leg of decline if it fails to hold the immediate low of 0.6900; a break below the same would expose the pair to 0.6800.
(The technical analysis of this story was written with the help of an AI tool. Know more.)
Economic Indicator
Employment Change s.a.
The Employment Change released by the Australian Bureau of Statistics is a measure of the change in the number of employed people in Australia. The statistic is adjusted to remove the influence of seasonal trends. Generally speaking, a rise in Employment Change has positive implications for consumer spending, stimulates economic growth, and is bullish for the Australian Dollar (AUD). A low reading, on the other hand, is seen as bearish.
Read more.Last release: Thu Oct 15, 2026 00:30
Frequency: Monthly
Actual: -39.3K
Consensus: 20K
Previous: 39.5K
Source: Australian Bureau of Statistics
Recommended Articles


