Japanese Yen receives pressure after dovish comments from Minister Shindo

Source Fxstreet
  • The Japanese Yen weakened as Minister Yoshitaka Shindo expressed the goal for the primary balance to achieve surplus territory by 2025.
  • The Jibun Bank Manufacturing PMI rose 50.4 MoM in May, indicating the first expansion since May 2023.
  • The US Dollar depreciated as Fed officials suggested no further interest rate hikes.

The Japanese Yen (JPY) depreciates, with Japanese Economy Minister Yoshitaka Shindo announcing on Monday that the government will “continue efforts for primary balance to reach within surplus territory in FY 2025.” Shindo also expressed optimism, stating that “Real economic growth of 1.3% in FY 2025 is not so unrealistic,” per Reuters.

Japan's Tokyo Consumer Price Index (CPI), released on Friday, rose to 2.2% year-over-year in May, up from April's 1.8% rise. If nationwide inflation in Japan were to decline, it would likely deter the Bank of Japan (BoJ) from raising interest rates. The substantial interest rate differential between Japan and other countries continues to exert pressure on the Japanese Yen, supporting the USD/JPY pair.

US Dollar Index (DXY), which measures the value of the US Dollar (USD) against six other major currencies, lost ground after the release of the Federal Reserve's preferred US Personal Consumption Expenditure (PCE) data, showing a moderation in price pressures in April.

Last week, Federal Reserve (Fed) officials suggested that the central bank could potentially achieve its 2% annual inflation target without implementing additional interest rate hikes. This stance has led to downward pressure on US Treasury yields, weakening the Greenback.

Daily Digest Market Movers: Japanese Yen depreciates amid dovish BoJ officials

  • The Jibun Bank Japan Manufacturing PMI rose 50.4 month-on-month in May from April’s 49.6, indicating the first expansion in manufacturing activity since May 2023.
  • Reuters reported on Monday that Bank of Japan Executive Director Takashi Kato stated that “BoJ has no plan to immediately unload its exchange-traded funds (ETF) holdings.” Kato said, “I hope to spend time examining how to unload BoJ’s ETF holdings in the future.”
  • Japan’s Retail Sales (YoY) grew 2.4% in April, accelerating from a downwardly revised 1.1% rise in March and surpassing market forecasts of 1.9% growth. This marks the 26th consecutive month of expansion, indicating a sustained period of healthy consumption in Japan.
  • On Friday, the US PCE Index rose 0.3% MoM and 2.7% YoY in April, matching the expectations. The Core PCE, excluding the volatile food and energy, climbed 0.2% MoM in April, lower than the expected 0.3% rise. On an annual basis, the index jumped 2.8% as expected.
  • On Thursday, Atlanta Fed President Raphael Bostic remarked in an interview with Fox Business that he doesn't believe further rate hikes should be required to reach the Fed's 2% annual inflation target. Additionally, New York Fed President John Williams stated that inflation is still too high, but should moderate over the second half of 2024. Williams doesn't feel the urgency to act on monetary policy.

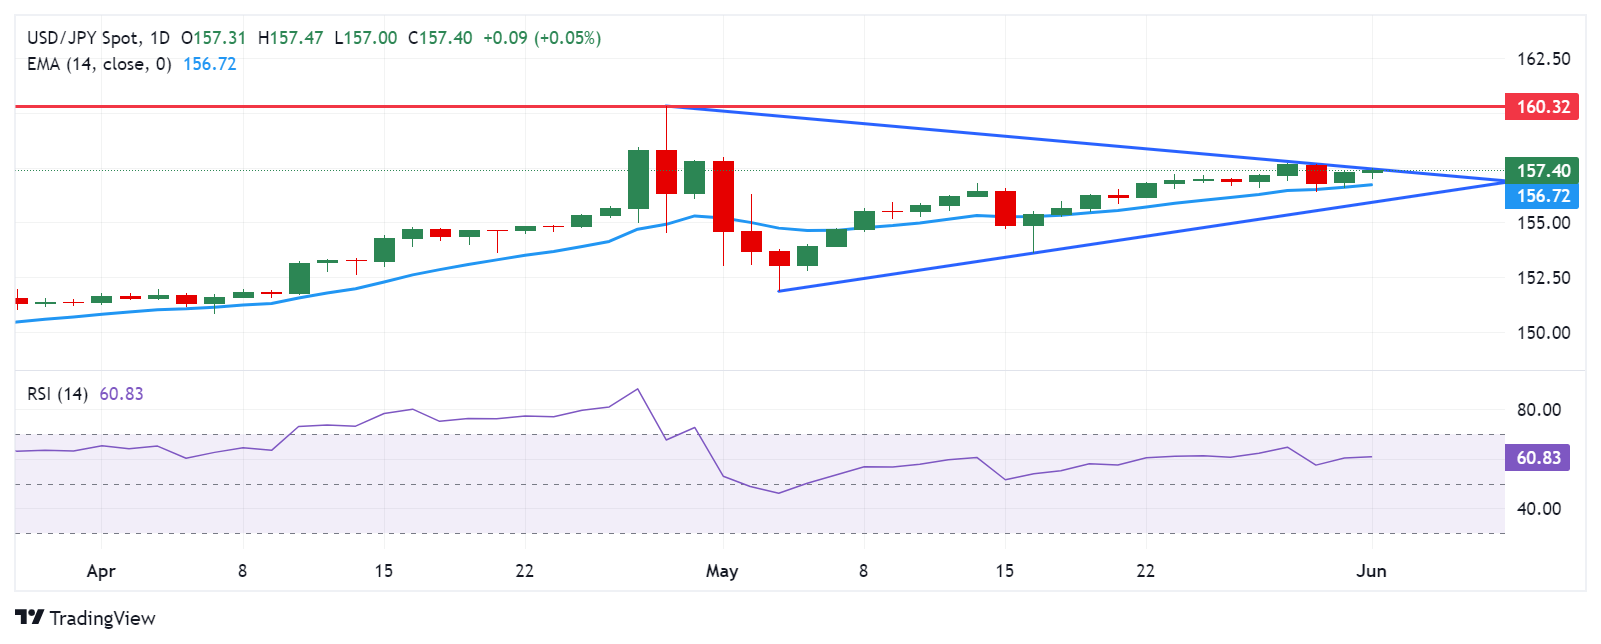
Technical Analysis: USD/JPY tests the key level of 157.50

The USD/JPY pair trades around 157.40 on Monday. Analysis of the daily chart shows a symmetrical triangle pattern, indicating a temporary pause in the prevailing bullish trend. However, the 14-day Relative Strength Index (RSI) remains above 50, suggesting a continued bullish bias for the pair.

In terms of potential price movements, the USD/JPY pair is testing the upper boundary of the symmetrical triangle, with the psychological level of 158.00 acting as the next target. A breach above this level could provide support for the pair to retest 160.32, which represents its highest level in over thirty years.

Conversely, immediate support is seen at the psychological level of 157.00, followed by the 14-day Exponential Moving Average (EMA) at 156.72. Further downward movement could lead the USD/JPY pair to navigate the area around the lower boundary of the symmetrical triangle.

USD/JPY: Daily Chart

Japanese Yen price today

The table below shows the percentage change of the Japanese Yen (JPY) against listed major currencies today. Japanese Yen was the weakest against the Euro.

  USD EUR GBP CAD AUD JPY NZD CHF
USD   0.00% 0.02% 0.05% 0.11% 0.13% 0.03% 0.00%
EUR 0.00%   0.02% 0.05% 0.10% 0.13% 0.03% 0.00%
GBP -0.02% -0.02%   0.03% 0.09% 0.12% 0.01% -0.02%
CAD -0.05% -0.05% -0.04%   0.05% 0.09% -0.02% -0.05%
AUD -0.11% -0.10% -0.09% -0.05%   0.05% -0.06% -0.11%
JPY -0.14% -0.14% -0.14% -0.10% -0.06%   -0.11% -0.14%
NZD -0.03% -0.03% -0.02% 0.02% 0.08% 0.11%   -0.03%
CHF 0.00% 0.00% 0.01% 0.05% 0.10% 0.14% 0.03%  

The heat map shows percentage changes of major currencies against each other. The base currency is picked from the left column, while the quote currency is picked from the top row. For example, if you pick the Euro from the left column and move along the horizontal line to the Japanese Yen, the percentage change displayed in the box will represent EUR (base)/JPY (quote).

Japanese Yen FAQs

The Japanese Yen (JPY) is one of the world’s most traded currencies. Its value is broadly determined by the performance of the Japanese economy, but more specifically by the Bank of Japan’s policy, the differential between Japanese and US bond yields, or risk sentiment among traders, among other factors.

One of the Bank of Japan’s mandates is currency control, so its moves are key for the Yen. The BoJ has directly intervened in currency markets sometimes, generally to lower the value of the Yen, although it refrains from doing it often due to political concerns of its main trading partners. The current BoJ ultra-loose monetary policy, based on massive stimulus to the economy, has caused the Yen to depreciate against its main currency peers. This process has exacerbated more recently due to an increasing policy divergence between the Bank of Japan and other main central banks, which have opted to increase interest rates sharply to fight decades-high levels of inflation.

The BoJ’s stance of sticking to ultra-loose monetary policy has led to a widening policy divergence with other central banks, particularly with the US Federal Reserve. This supports a widening of the differential between the 10-year US and Japanese bonds, which favors the US Dollar against the Japanese Yen.

The Japanese Yen is often seen as a safe-haven investment. This means that in times of market stress, investors are more likely to put their money in the Japanese currency due to its supposed reliability and stability. Turbulent times are likely to strengthen the Yen’s value against other currencies seen as more risky to invest in.


Disclaimer: For information purposes only. Past performance is not indicative of future results.
placeholder
U.S. November Nonfarm Payrolls: What Does the Rare "Weak Jobs, Strong Economy" Mix Mean for U.S. Equities?1. IntroductionAfter retreating from the late-October highs, U.S. equities embarked on a bottoming rebound in mid-to-late November, a trend driven by the interplay of multiple factors. That said, it i
Author  TradingKey
5 hours ago
1. IntroductionAfter retreating from the late-October highs, U.S. equities embarked on a bottoming rebound in mid-to-late November, a trend driven by the interplay of multiple factors. That said, it i
placeholder
Senate Delays Crypto Market Structure Hearings to Early 2026The Senate Banking Committee has postponed cryptocurrency market structure hearings until 2026, citing ongoing bipartisan negotiations.
Author  Mitrade
10 hours ago
The Senate Banking Committee has postponed cryptocurrency market structure hearings until 2026, citing ongoing bipartisan negotiations.
placeholder
Bitcoin Slides 5% as Sellers Lean In — Can BTC Reclaim $88,000?Bitcoin has dropped back below $88,000 after rolling over from $90,500, with price still trading under the 100-hour Simple Moving Average. The sell-off found a floor at $85,151, and BTC is now consolidating near that base, but rebounds are facing pressure from a bearish trend line around $89,000. Bulls need to retake $88,000–$89,000 to ease downside risk; failure to do so keeps $85,500–$85,000 and then $83,500 in play, with $80,000 as the deeper “line in the sand.” Bitcoin (BTC) is back in damage-control mode after a sharp pullback wiped out recent gains. The price failed to reclaim the $90,000–$90,500 band, rolled over, and slid through $88,500 before briefly dipping under $87,000. Buyers did show up around $85,000, but the rebound so far looks more like stabilization than a clear trend reversal. Bitcoin dips hard, finds a bid near $85,000(h3) BTC’s latest move lower began when it couldn’t build follow-through above $90,000 and $90,500. Once that upside stalled, sellers took control and pushed price down through $88,500. The slide accelerated enough to spike below $87,000, but the market didn’t free-fall. Bulls defended the $85,000 zone, printing a low at $85,151. Since then, Bitcoin has been consolidating below the 23.6% Fibonacci retracement of the drop from the $93,560 swing high to the $85,151 low — a clue that the bounce is still shallow and that sellers haven’t fully backed off yet. Structurally, BTC is still on the back foot: It’s trading below $88,000, and It remains below the 100-hour Simple Moving Average, keeping short-term trend pressure pointed downward. Resistance is layered, and $89,000 is the problem area(h3) If bulls try to turn this into a recovery, they’ll have to climb through multiple ceilings in quick succession. First, BTC faces resistance around $87,150, followed by a more meaningful barrier near $87,500. From there, the market’s attention snaps back to $88,000 — the level BTC just lost and now needs to reclaim. A close back above $88,000 would improve the tone, but it doesn’t solve the bigger issue: there’s a bearish trend line on the hourly BTC/USD chart (Kraken feed) with resistance near $89,000, which also lines up with the next technical hurdle. If BTC can push through $89,000 and hold, the rebound could extend toward $90,000, with follow-through targets at $91,000 and $91,500. But until price clears that $88,000–$89,000 zone, rallies are at risk of being sold rather than chased. If BTC fails to reclaim resistance, the downside path is clear(h3) The near-term bear case is simple: if Bitcoin can’t climb back above the $87,000 area and keep traction, sellers may attempt another leg lower. Support levels line up like this: Immediate support: $85,500 First major support: $85,000 Next support: $83,500 Then $82,500 in the near term Below that, the major “don’t break this” level is still $80,000. If BTC slips under $80,000, the risk of acceleration to the downside increases significantly — not because it’s magic, but because it’s the kind of psychological and structural level that tends to trigger forced de-risking. Indicators: momentum still leans bearish(h3) The intraday indicators aren’t offering much comfort yet: Hourly MACD is losing pace in the bearish zone. Hourly RSI remains below 50, suggesting sellers still have the upper hand on short timeframes. So while the $85,000 defense held for now, the market hasn’t flipped bullish — it’s just stopped bleeding.
Author  Mitrade
13 hours ago
Bitcoin has dropped back below $88,000 after rolling over from $90,500, with price still trading under the 100-hour Simple Moving Average. The sell-off found a floor at $85,151, and BTC is now consolidating near that base, but rebounds are facing pressure from a bearish trend line around $89,000. Bulls need to retake $88,000–$89,000 to ease downside risk; failure to do so keeps $85,500–$85,000 and then $83,500 in play, with $80,000 as the deeper “line in the sand.” Bitcoin (BTC) is back in damage-control mode after a sharp pullback wiped out recent gains. The price failed to reclaim the $90,000–$90,500 band, rolled over, and slid through $88,500 before briefly dipping under $87,000. Buyers did show up around $85,000, but the rebound so far looks more like stabilization than a clear trend reversal. Bitcoin dips hard, finds a bid near $85,000(h3) BTC’s latest move lower began when it couldn’t build follow-through above $90,000 and $90,500. Once that upside stalled, sellers took control and pushed price down through $88,500. The slide accelerated enough to spike below $87,000, but the market didn’t free-fall. Bulls defended the $85,000 zone, printing a low at $85,151. Since then, Bitcoin has been consolidating below the 23.6% Fibonacci retracement of the drop from the $93,560 swing high to the $85,151 low — a clue that the bounce is still shallow and that sellers haven’t fully backed off yet. Structurally, BTC is still on the back foot: It’s trading below $88,000, and It remains below the 100-hour Simple Moving Average, keeping short-term trend pressure pointed downward. Resistance is layered, and $89,000 is the problem area(h3) If bulls try to turn this into a recovery, they’ll have to climb through multiple ceilings in quick succession. First, BTC faces resistance around $87,150, followed by a more meaningful barrier near $87,500. From there, the market’s attention snaps back to $88,000 — the level BTC just lost and now needs to reclaim. A close back above $88,000 would improve the tone, but it doesn’t solve the bigger issue: there’s a bearish trend line on the hourly BTC/USD chart (Kraken feed) with resistance near $89,000, which also lines up with the next technical hurdle. If BTC can push through $89,000 and hold, the rebound could extend toward $90,000, with follow-through targets at $91,000 and $91,500. But until price clears that $88,000–$89,000 zone, rallies are at risk of being sold rather than chased. If BTC fails to reclaim resistance, the downside path is clear(h3) The near-term bear case is simple: if Bitcoin can’t climb back above the $87,000 area and keep traction, sellers may attempt another leg lower. Support levels line up like this: Immediate support: $85,500 First major support: $85,000 Next support: $83,500 Then $82,500 in the near term Below that, the major “don’t break this” level is still $80,000. If BTC slips under $80,000, the risk of acceleration to the downside increases significantly — not because it’s magic, but because it’s the kind of psychological and structural level that tends to trigger forced de-risking. Indicators: momentum still leans bearish(h3) The intraday indicators aren’t offering much comfort yet: Hourly MACD is losing pace in the bearish zone. Hourly RSI remains below 50, suggesting sellers still have the upper hand on short timeframes. So while the $85,000 defense held for now, the market hasn’t flipped bullish — it’s just stopped bleeding.
placeholder
AUD/USD remains depressed below mid-0.6600s; downside seems limited ahead of US NFP reportThe AUD/USD pair attracts some sellers for the fourth straight day on Tuesday and trades around the 0.6630 region, down just over 0.10%, during the Asian session.
Author  FXStreet
14 hours ago
The AUD/USD pair attracts some sellers for the fourth straight day on Tuesday and trades around the 0.6630 region, down just over 0.10%, during the Asian session.
placeholder
Macro Analysts: Hawkish Japan Could Push Bitcoin Below $70KAnalysts predict Bitcoin may face further declines towards the $70,000 mark if the Bank of Japan raises interest rates as expected.
Author  Mitrade
Yesterday 05: 48
Analysts predict Bitcoin may face further declines towards the $70,000 mark if the Bank of Japan raises interest rates as expected.
goTop
quote