


Canadian Dollar rebounds as market sentiment recovers, Greenback softens
- Canadian Dollar pivots into high side on Thursday amid fresh risk appetite.
- Canada finds better-than-expected Current Account figures.
- US GDP growth cooled as expected, sparking fresh rate cut hopes.
The Canadian Dollar (CAD) is rebounding on Thursday, recovering ground previously lost in the midweek market session as broad market flows in the Greenback dictate overall market sentiment. Canadian trade balance numbers fell in the first quarter, but less than expected, helping to bolster the CAD.
Canada saw a -5.37 billion contraction in its Q1 Current Account, worse than the previous quarter but still better than median market estimates. US Gross Domestic Product (GDP) growth in the first quarter eased slightly, in-line with market forecasts, prompting a flurry of re-ignited hopes for rate cuts from the Federal Reserve (Fed).
Daily digest market movers: Canadian Dollar pushed higher by broad Greenback selling
- Canadian Q1 Current Account declined -5.37 billion compared to the previous quarter’s revised -4.51 billion, but better than the forecast -5.5 billion.
- US Annualized Q1 GDP growth eased to 1.3% as expected, falling back from the previous 1.6% print.
- US Core Personal Consumption Expenditures (PCE) in Q1 also eased, ticking down to 3.6% from the forecast for a hold at 3.7%, sparking hopes of further inflation easing.
- US Initial Jobless Claims for the week ended May 24 also rose to 219K, over the forecast of 218K and weaker than the previous week’s revised 216K, helping to provide support to the “bad news is good news” market narrative.
- Friday will close off the trading week with a hectic schedule. Canadian Q1 GDP growth figures will be released side-by-side with US PCE Price Index inflation data for April.
- Canadian Annualized Q1 GDP is expected to rebound to 2.2% from the previous 1.0%.
- US core PCE Price Index inflation in April is forecast to hold steady at 0.3% MoM.
Canadian Dollar PRICE Today
The table below shows the percentage change of Canadian Dollar (CAD) against listed major currencies today. Canadian Dollar was the weakest against the Swiss Franc.
| USD | EUR | GBP | JPY | CAD | AUD | NZD | CHF | |
|---|---|---|---|---|---|---|---|---|
| USD | -0.38% | -0.33% | -0.61% | -0.38% | -0.53% | -0.20% | -1.06% | |
| EUR | 0.38% | 0.05% | -0.20% | -0.00% | -0.14% | 0.16% | -0.68% | |
| GBP | 0.33% | -0.05% | -0.26% | -0.07% | -0.21% | 0.11% | -0.73% | |
| JPY | 0.61% | 0.20% | 0.26% | 0.20% | 0.06% | 0.33% | -0.46% | |
| CAD | 0.38% | 0.00% | 0.07% | -0.20% | -0.13% | 0.17% | -0.68% | |
| AUD | 0.53% | 0.14% | 0.21% | -0.06% | 0.13% | 0.30% | -0.52% | |
| NZD | 0.20% | -0.16% | -0.11% | -0.33% | -0.17% | -0.30% | -0.84% | |
| CHF | 1.06% | 0.68% | 0.73% | 0.46% | 0.68% | 0.52% | 0.84% |
The heat map shows percentage changes of major currencies against each other. The base currency is picked from the left column, while the quote currency is picked from the top row. For example, if you pick the Canadian Dollar from the left column and move along the horizontal line to the US Dollar, the percentage change displayed in the box will represent CAD (base)/USD (quote).
Technical analysis: Canadian Dollar regains familiar chart territory in Thursday pivot
The Canadian Dollar (CAD) is rebounding in a broad-market risk appetite recovery, climbing four-tenths of a percent against the US Dollar amid Greenback weakness across the board. The CAD is still down six-tenths of a percent against the Swiss Franc (CHF) and around a fifth of a percent against the Japanese Yen (JPY).
USD/CAD has fallen back to familiar levels near 1.3660 on Thursday in a quick turnaround from Wednesday’s peak near 1.3735. The pair is running into near-term technical resistance at the 200-hour Exponential Moving Average (EMA) at 1.3670, with an intraday floor priced in at this week’s swing low into 1.3615.
Daily candles continue to etch in a rough consolidation pattern, and USD/CAD is mired in a sideways grind near the 50-day EMA at 1.3646. Long-term technical support is coming from the 200-day EMA at 1.3557.
USD/CAD hourly chart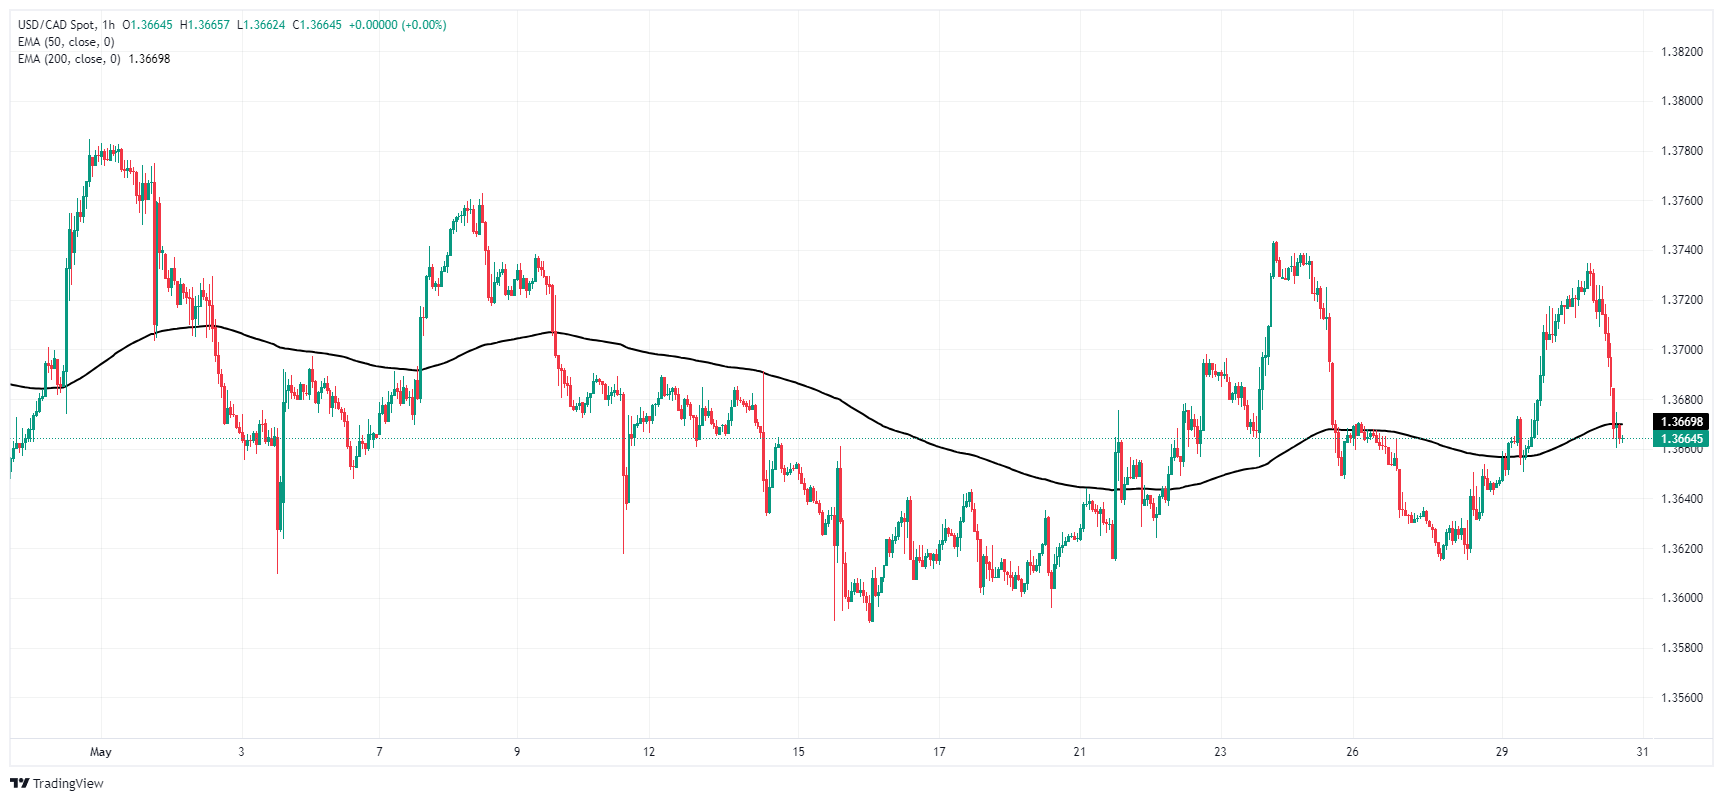
USD/CAD daily chart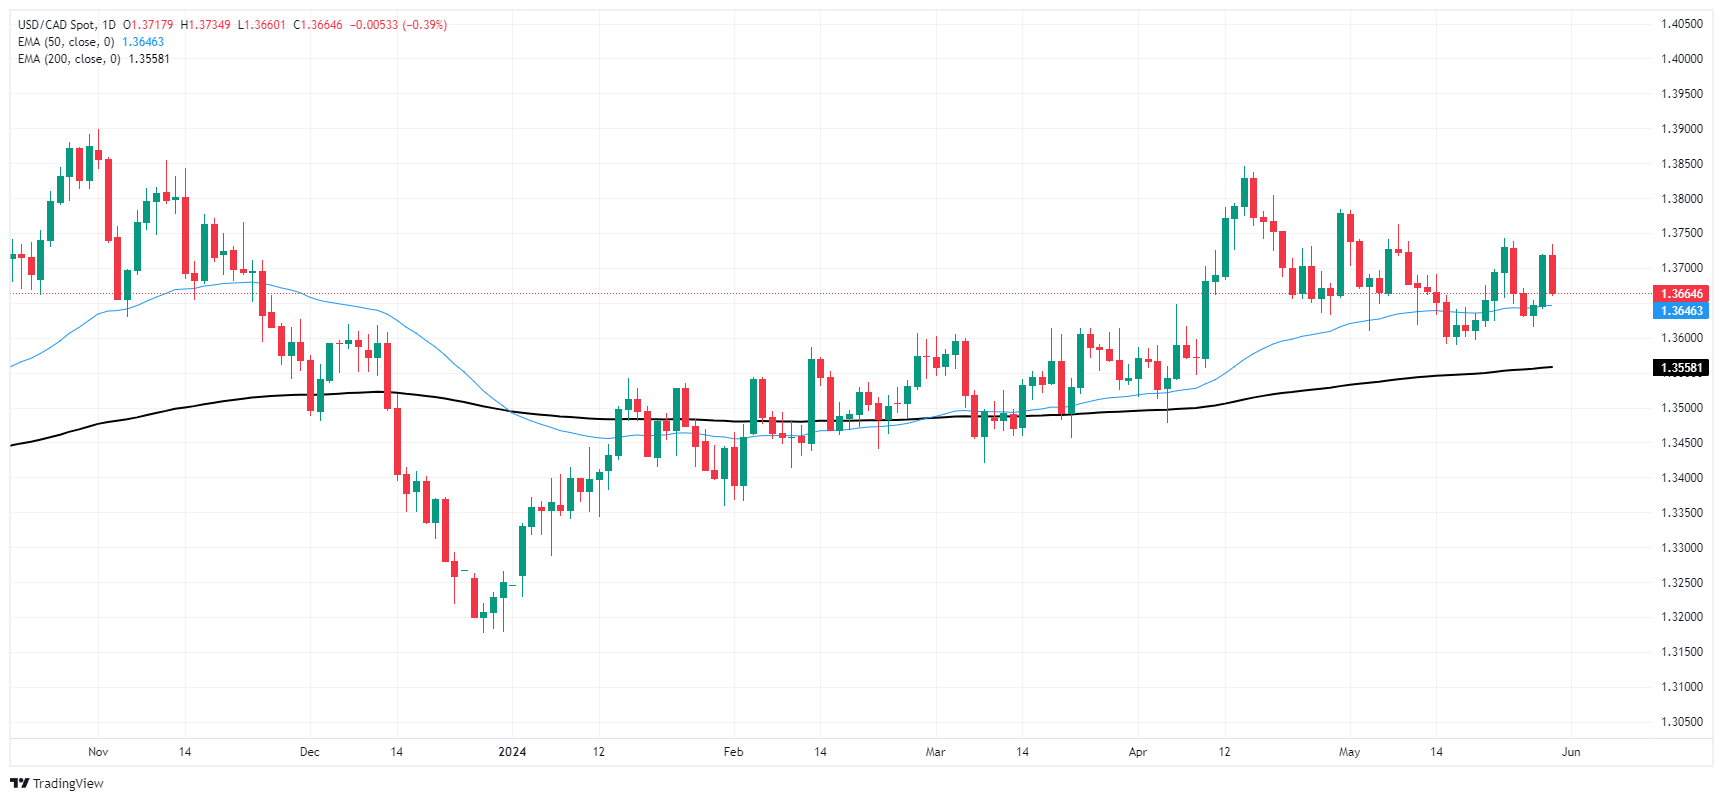
Canadian Dollar FAQs
The key factors driving the Canadian Dollar (CAD) are the level of interest rates set by the Bank of Canada (BoC), the price of Oil, Canada’s largest export, the health of its economy, inflation and the Trade Balance, which is the difference between the value of Canada’s exports versus its imports. Other factors include market sentiment – whether investors are taking on more risky assets (risk-on) or seeking safe-havens (risk-off) – with risk-on being CAD-positive. As its largest trading partner, the health of the US economy is also a key factor influencing the Canadian Dollar.
The Bank of Canada (BoC) has a significant influence on the Canadian Dollar by setting the level of interest rates that banks can lend to one another. This influences the level of interest rates for everyone. The main goal of the BoC is to maintain inflation at 1-3% by adjusting interest rates up or down. Relatively higher interest rates tend to be positive for the CAD. The Bank of Canada can also use quantitative easing and tightening to influence credit conditions, with the former CAD-negative and the latter CAD-positive.
The price of Oil is a key factor impacting the value of the Canadian Dollar. Petroleum is Canada’s biggest export, so Oil price tends to have an immediate impact on the CAD value. Generally, if Oil price rises CAD also goes up, as aggregate demand for the currency increases. The opposite is the case if the price of Oil falls. Higher Oil prices also tend to result in a greater likelihood of a positive Trade Balance, which is also supportive of the CAD.
While inflation had always traditionally been thought of as a negative factor for a currency since it lowers the value of money, the opposite has actually been the case in modern times with the relaxation of cross-border capital controls. Higher inflation tends to lead central banks to put up interest rates which attracts more capital inflows from global investors seeking a lucrative place to keep their money. This increases demand for the local currency, which in Canada’s case is the Canadian Dollar.
Macroeconomic data releases gauge the health of the economy and can have an impact on the Canadian Dollar. Indicators such as GDP, Manufacturing and Services PMIs, employment, and consumer sentiment surveys can all influence the direction of the CAD. A strong economy is good for the Canadian Dollar. Not only does it attract more foreign investment but it may encourage the Bank of Canada to put up interest rates, leading to a stronger currency. If economic data is weak, however, the CAD is likely to fall.
Recommended Articles


