

Canadian Dollar follows broader market flows as investors grapple with US PCE inflation
- Canadian Dollar gets pushed around as investors focus elsewhere.
- Canada absent from economic calendar until next week.
- US PCE inflation remains higher than expected, weighing on rate cut hopes.
The Canadian Dollar (CAD) is taking a back seat to broader market flows on Friday as investor focus remains pinned on decaying hopes for a rate cut from the Federal Reserve (Fed). US Personal Consumption Expenditure (PCE) Price Index figures came in above expectations on Friday, weighing further on rate trim expectations.
Canada will not release meaningful data until next Tuesday’s Gross Domestic Product (GDP) print, but all eyes will be on the Fed’s upcoming rate call next Wednesday. Markets will also be gearing up for another Nonfarm Payrolls (NFP) next week as investors look further out for signs of a slowdown in the US economy that could spark rate cuts.
Daily digest market movers: US PCE inflation remains stubbornly hot
- Core US PCE Price Index inflation held steady in March, printing at the expected steady 0.3%.
- YoY Core PCE Price Index also held steady at 2.8%, flaunting the forecast of 2.6%.
- Annualized headline PCE Price Index for the year ended March ticked higher to 2.7% versus the expected 2.6%, accelerating from the previous 2.5%.
- With inflation stubbornly high, hopes for a September rate cut are eroding.
- According to the CME’s FedWatch Tool, rate markets only see 60% odds of a September Fed rate trim.
- Read more: US Core PCE inflation holds steady at 2.8% vs. 2.6% expected
Canadian Dollar price today
The table below shows the percentage change of Canadian Dollar (CAD) against listed major currencies today. Canadian Dollar was the strongest against the Japanese Yen.
| USD | EUR | GBP | CAD | AUD | JPY | NZD | CHF | |
| USD | 0.35% | 0.21% | 0.12% | -0.10% | 1.32% | 0.30% | 0.18% | |
| EUR | -0.34% | -0.13% | -0.21% | -0.43% | 0.97% | -0.04% | -0.16% | |
| GBP | -0.21% | 0.12% | -0.09% | -0.32% | 1.11% | 0.08% | -0.04% | |
| CAD | -0.13% | 0.21% | 0.09% | -0.23% | 1.19% | 0.15% | 0.06% | |
| AUD | 0.10% | 0.44% | 0.32% | 0.24% | 1.42% | 0.38% | 0.29% | |
| JPY | -1.35% | -0.98% | -1.12% | -1.21% | -1.43% | -1.02% | -1.15% | |
| NZD | -0.30% | 0.04% | -0.09% | -0.15% | -0.38% | 1.04% | -0.09% | |
| CHF | -0.18% | 0.16% | 0.03% | -0.05% | -0.28% | 1.13% | 0.11% |
The heat map shows percentage changes of major currencies against each other. The base currency is picked from the left column, while the quote currency is picked from the top row. For example, if you pick the Euro from the left column and move along the horizontal line to the Japanese Yen, the percentage change displayed in the box will represent EUR (base)/JPY (quote).
Technical analysis: Canadian Dollar plays second fiddle to US Dollar flows
The Canadian Dollar (CAD) is mixed on Friday, playing a quiet counterparty to broader market focus. The CAD has gained 1.2% on the day against the Japanese Yen as markets short the Yen wholesale. The CAD is up around a quarter of a percent against the Euro (EUR), and down a quarter of a percent against the Australian Dollar (AUD).
USD/CAD continues to churn between 1.3700 and 1.3660, but downside swings are reaching further into bearish territory. The pair still trades on the north side of the 200-day Exponential Moving Average (EMA) at 1.3527, but USD/CAD remains down 1.2% from the last swing high near 1.3850.
USD/CAD hourly chart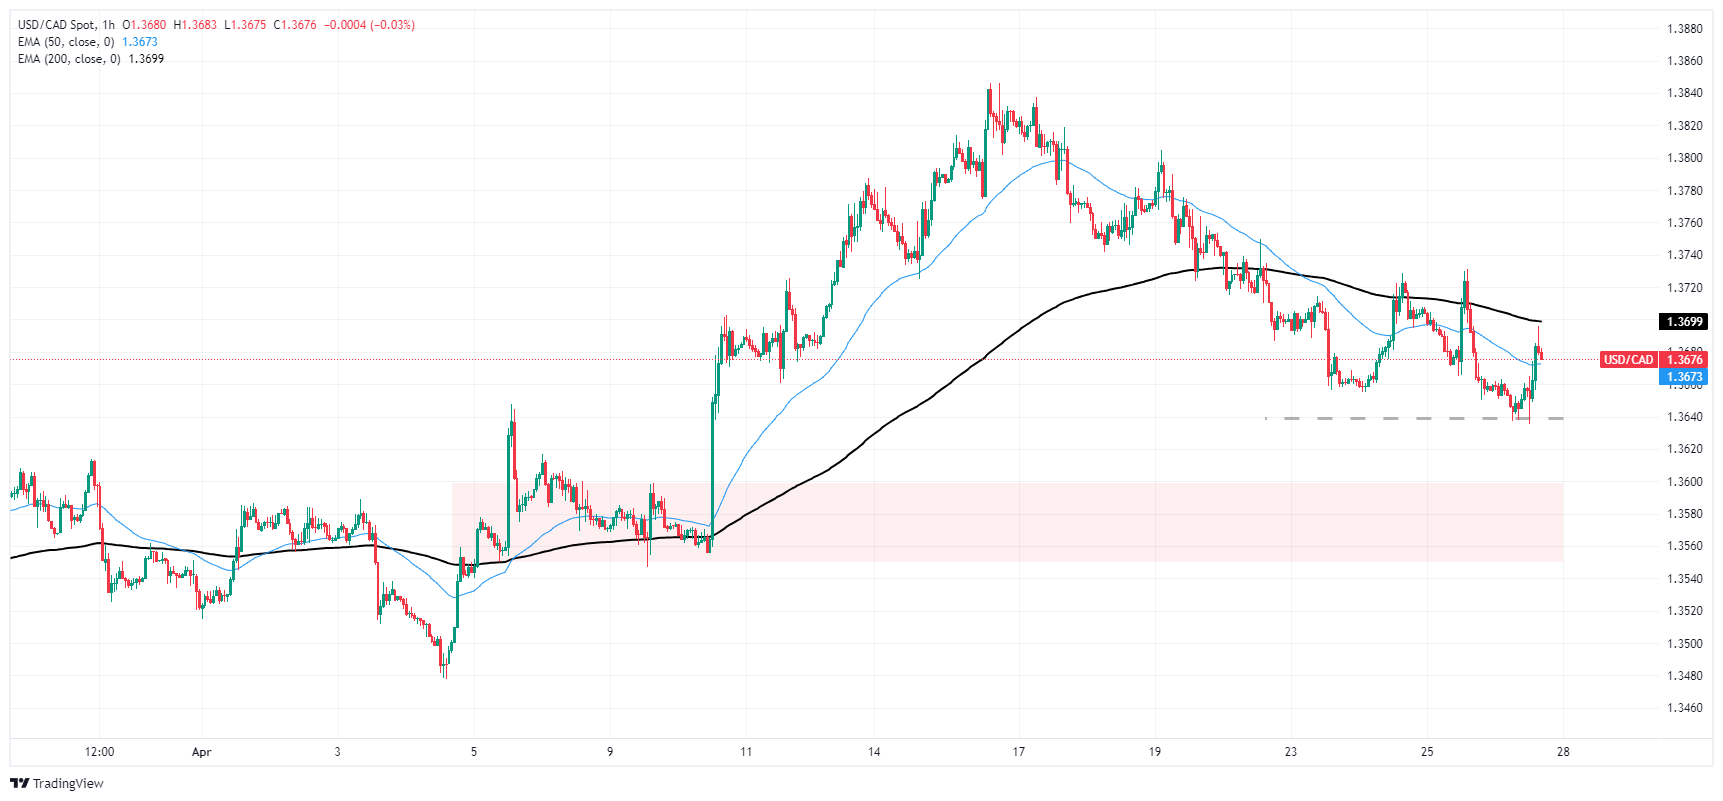
USD/CAD daily chart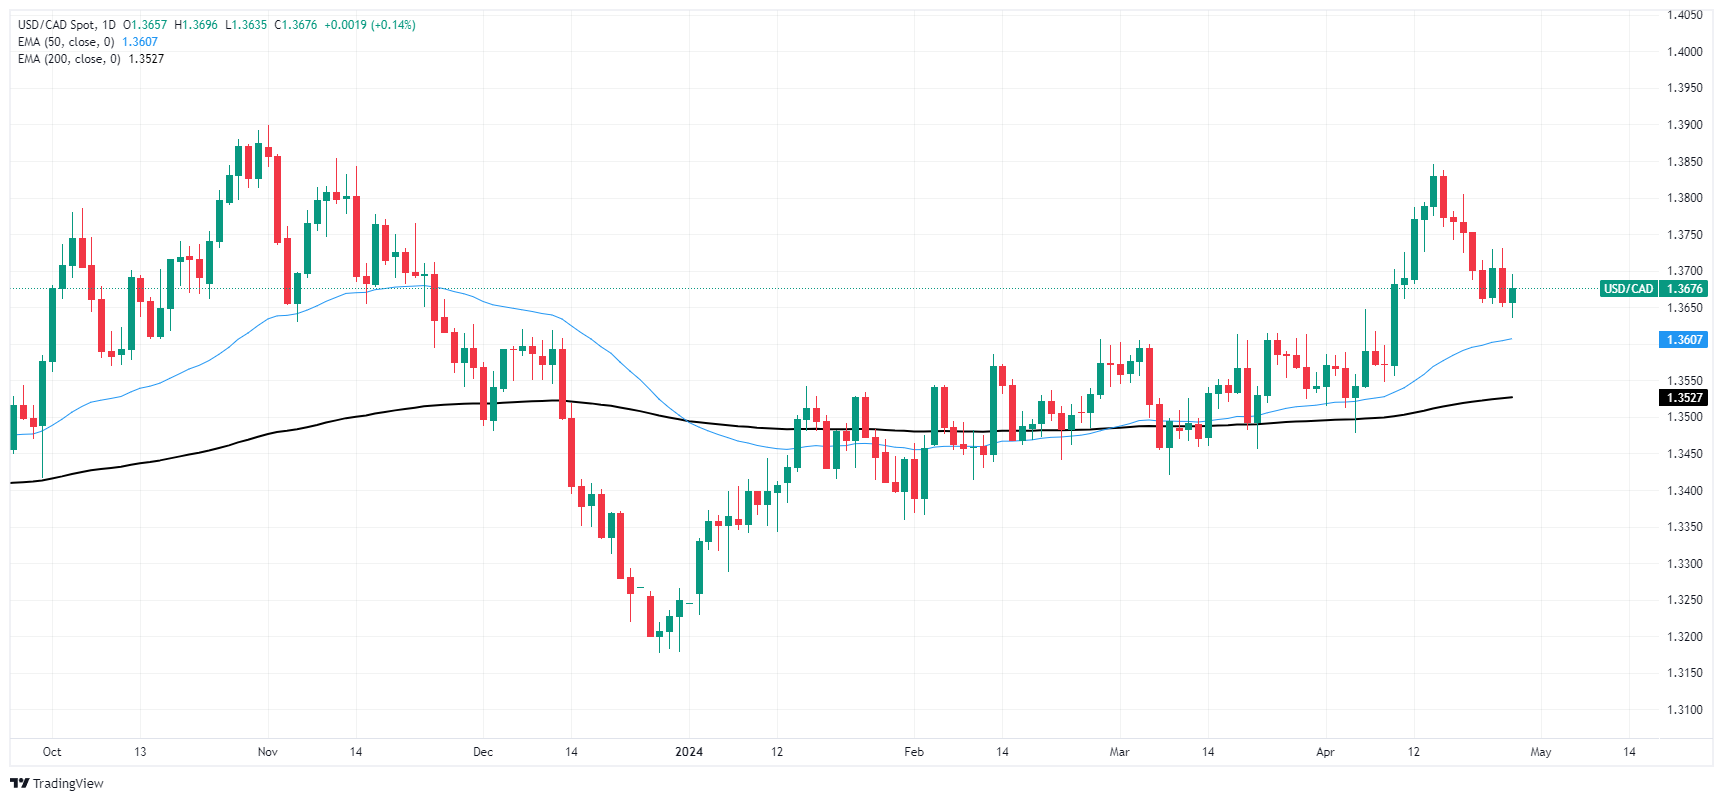
Canadian Dollar FAQs
The key factors driving the Canadian Dollar (CAD) are the level of interest rates set by the Bank of Canada (BoC), the price of Oil, Canada’s largest export, the health of its economy, inflation and the Trade Balance, which is the difference between the value of Canada’s exports versus its imports. Other factors include market sentiment – whether investors are taking on more risky assets (risk-on) or seeking safe-havens (risk-off) – with risk-on being CAD-positive. As its largest trading partner, the health of the US economy is also a key factor influencing the Canadian Dollar.
The Bank of Canada (BoC) has a significant influence on the Canadian Dollar by setting the level of interest rates that banks can lend to one another. This influences the level of interest rates for everyone. The main goal of the BoC is to maintain inflation at 1-3% by adjusting interest rates up or down. Relatively higher interest rates tend to be positive for the CAD. The Bank of Canada can also use quantitative easing and tightening to influence credit conditions, with the former CAD-negative and the latter CAD-positive.
The price of Oil is a key factor impacting the value of the Canadian Dollar. Petroleum is Canada’s biggest export, so Oil price tends to have an immediate impact on the CAD value. Generally, if Oil price rises CAD also goes up, as aggregate demand for the currency increases. The opposite is the case if the price of Oil falls. Higher Oil prices also tend to result in a greater likelihood of a positive Trade Balance, which is also supportive of the CAD.
While inflation had always traditionally been thought of as a negative factor for a currency since it lowers the value of money, the opposite has actually been the case in modern times with the relaxation of cross-border capital controls. Higher inflation tends to lead central banks to put up interest rates which attracts more capital inflows from global investors seeking a lucrative place to keep their money. This increases demand for the local currency, which in Canada’s case is the Canadian Dollar.
Macroeconomic data releases gauge the health of the economy and can have an impact on the Canadian Dollar. Indicators such as GDP, Manufacturing and Services PMIs, employment, and consumer sentiment surveys can all influence the direction of the CAD. A strong economy is good for the Canadian Dollar. Not only does it attract more foreign investment but it may encourage the Bank of Canada to put up interest rates, leading to a stronger currency. If economic data is weak, however, the CAD is likely to fall.
Recommended Articles


