


Arm Holdings PLC Stock (ARM) Moved Up by 5.69% on Oct 26: What Investors Need To Know
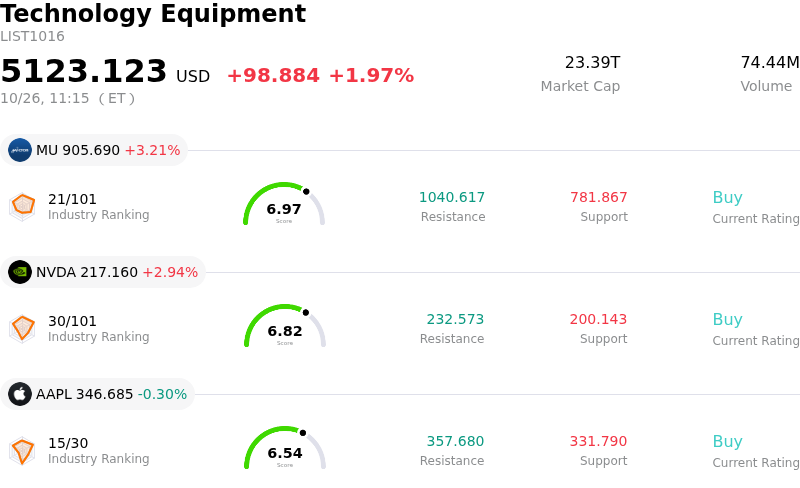
Arm Holdings PLC (ARM) moved up by 5.69%. The Technology Equipment sector is up by 1.97%. The company outperformed the industry. Top 3 stocks by turnover in the sector: Micron Technology Inc (MU) up 3.21%; NVIDIA Corp (NVDA) up 2.91%; Apple Inc (AAPL) down 0.25%.
What is driving Arm Holdings PLC (ARM)’s stock price up today?
Arm Holdings experienced a positive trading session marked by heightened intraday volatility, largely reflecting a technical rebound following a steep pullback across the technology and semiconductor sectors over preceding weeks. Sentiment received a substantial boost from favorable Wall Street research updates. Brokerage reports reiterated bullish ratings and ambitious price targets, emphasizing the company's dominant position in central processing unit intellectual property and its expanding footprint within data centers, automotive computing, and custom silicon architectures.
Fundamental momentum surrounding artificial intelligence compute demand continues to serve as a core driver for institutional interest. Investors are increasingly focused on the expansion of royalty revenue streams in cloud data centers and high-performance computing platforms, alongside long-term licensing opportunities. With the company's upcoming earnings release on the horizon, market participants positioned themselves to capture potential upside linked to next-generation silicon adoption and high-margin architecture licensing.
However, the elevated volatility highlights ongoing debates regarding rich valuation multiples and sector-wide risk factors. Investors remain watchful of potential supply chain constraints across partner semiconductor foundries, escalating operational expenditures, and broader hardware spending trends. Despite these short-term headwinds, aggressive dip-buying during intraday swings underscores investor confidence in Arm's structural advantages as artificial intelligence workloads transition from training to edge and cloud inference.
Technical Analysis of Arm Holdings PLC (ARM)
Technically, Arm Holdings PLC (ARM) shows a MACD (12,26,9) value of -11.315, indicating a sell signal. The RSI at 37.748 suggests neutral condition and the Williams %R at 84.821 suggests oversold condition. Please monitor closely.
Fundamental Analysis of Arm Holdings PLC (ARM)
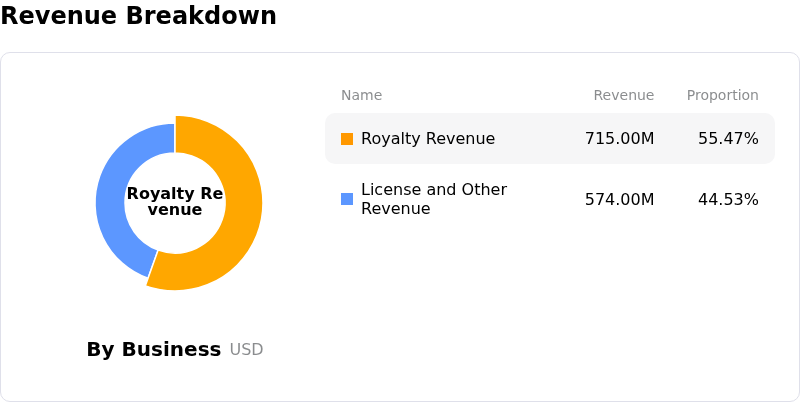
Arm Holdings PLC (ARM) is in the Technology Equipment industry. Its latest annual revenue is $4.92B, ranking 24 in the industry. The net profit is $904.00M, ranking 18 in the industry. Company Profile
Over the past month, multiple analysts have rated the company as Buy, with an average price target of $286.95, a high of $480.00, and a low of $125.00.
More details about Arm Holdings PLC (ARM)
Company Specific Risks:
- Qualcomm Licensing Dispute and Royalty Revenue Vulnerability: Escalating federal court litigation with key licensee Qualcomm over architecture contracts threatens core revenue streams, as potential remedies like royalty suspensions or altered licensing terms create significant overhang on Arm's high-margin royalty model.
- Channel Conflict and Licensee Backlash: Arm's vertical expansion into designing in-house AGI and data center server CPUs places it in direct competition with major licensing partners like Qualcomm and Nvidia, raising the risk of customer pushback and license diversification.
- Extreme Valuation Multiples and Delayed AI Uplift: Trading at significant forward earnings and sales multiples relative to semiconductor peers leaves the stock hypersensitive to pullbacks, particularly as institutional analysts warn that material royalty revenue from agentic AI implementations remains years away rather than immediate.
- Foundry Bottlenecks and Margin Compression: Upstream foundry capacity constraints and memory supply shortages threaten smartphone shipment volumes—a primary royalty generator—while elevated R&D spending required for custom chip design pressures near-term operating margins.
Recommended Articles


