

Bitcoin (BTCUSD) Suddenly Goes down 1.09% on Oct 26: What's Driving This

Source Tradingkey

Bitcoin (BTCUSD) is down 1.09% at Oct 26 21:50(ET), now at $79585.45, with a 7-day down of 2.94%.
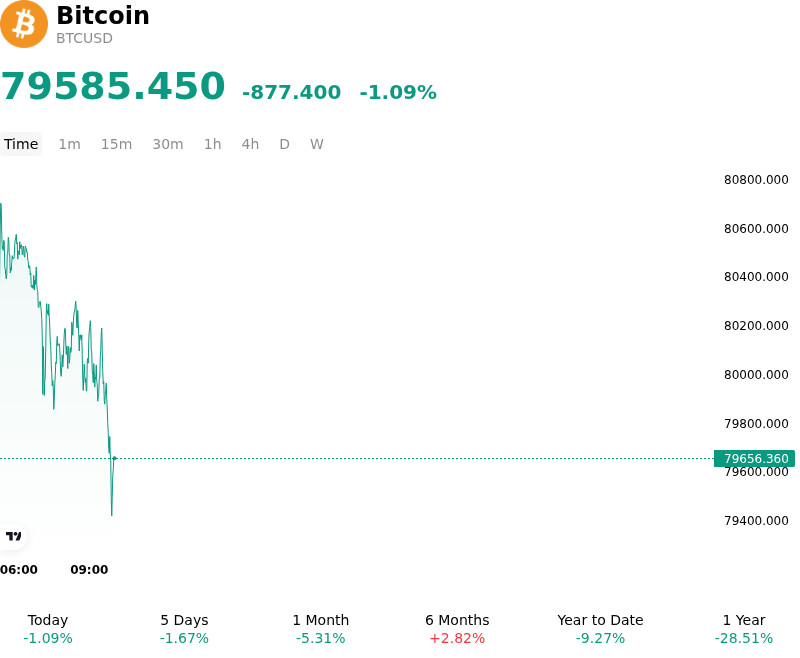
SummaryOverview

What is driving Bitcoin (BTCUSD)’s stock price down today?

Institutional profit-taking and a noticeable slowdown in spot ETF demand weighed on Bitcoin during the session, as investors pulled capital back amid broader macroeconomic uncertainties. Recent net outflows from U.S. spot Bitcoin ETFs created immediate overhead pressure, signaling a temporary pause in institutional accumulation. Furthermore, elevated energy prices and sticky inflation expectations heightened market caution ahead of the upcoming Federal Reserve policy meeting, prompting a general derisking across risk-sensitive assets as investors re-evaluated liquidity conditions and borrowing costs.

The decline was amplified by market structure and derivatives positioning. As Bitcoin tested crucial technical support around key psychological levels, a cluster of leveraged long positions entered at higher price levels faced mounting margin pressure. Slippage below short-term holder and spot ETF cost bases triggered localized long liquidations in the perpetual futures market, accelerating downside momentum into order book gaps. Reduced buy-side market depth further constrained liquidity, leaving the market more sensitive to concentrated institutional selling.

Despite the short-term weakness, the move largely reflects an event-driven liquidity repricing and leverage unwinding rather than a structural deterioration in blockchain ecosystem fundamentals. Institutional investors continue to monitor whether spot ETF inflows resume and how macroeconomic liquidity evolves following central bank messaging. Until clearer signals emerge regarding monetary policy trajectories and institutional risk appetite, Bitcoin is expected to trade within a broader consolidation range as market participants seek a firm price floor before re-engaging in sustained capital deployment.

Technical Analysis of Bitcoin (BTCUSD)

Technically, Bitcoin (BTCUSD) shows a MACD (12,26,9) value of -773.875, indicating a sell signal. The RSI at 40.183 suggests neutral condition and the Williams %R at 91.642 suggests oversold condition. Please monitor closely.
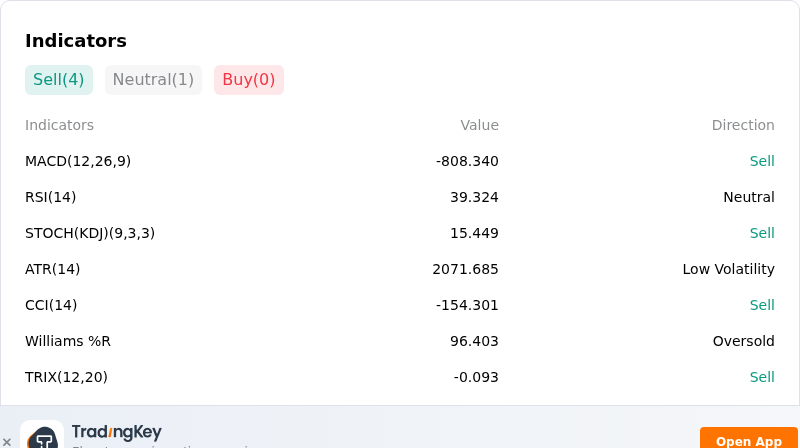
IndicatorAnalysis

More details about Bitcoin (BTCUSD)

Recent Events and Risks:

  • Institutional Spot ETF Outflows: U.S. spot Bitcoin ETFs experienced significant multi-day net outflows totaling over $770 million—led by heavy redemptions in major products including BlackRock's IBIT and Fidelity's FBTC—signaling a sharp temporary pullback in institutional liquidity.
  • Elevated Leverage and Liquidation Cascade Risk: Derivatives open interest built up despite falling spot prices, triggering more than $440 million in long position liquidations within 24 hours and leaving the market vulnerable to accelerated forced selling if prices drop below key support near $80,000.
  • Macro Risk-Off Sentiment and Fed Uncertainty: Weakness across equity markets, persistent inflation fears, and cautious positioning ahead of upcoming Federal Reserve interest rate decisions are restricting capital inflows and exacerbating intraday volatility.
  • Heavy Overhead Supply and Breakeven Resistance: Repeated rejections at the $85,000–$86,500 resistance zone reflect a dense cluster of underwater holders selling into price bounces, limiting upside momentum and leaving price action vulnerable near support levels.
Disclaimer: For information purposes only. Past performance is not indicative of future results.
placeholder
The Fed will sit still on October 28 — but 100 of 100 economists now expect a December hikeA Reuters poll run October 16-20 found 94 of 100 economists expecting the Fed to hold at 3.75-4.00% on October 28 — and all 100 expecting a hike in December, against less than half a month earlier. The market is close to the same price, with CME FedWatch at roughly 17% for October and 82.8% for December. With the Fed in blackout since October 17, here are the five dates that decide the rest of the year, what each one is priced for, and the two directions each can take.
Author  Irene Q.
Oct 22, Thu
A Reuters poll run October 16-20 found 94 of 100 economists expecting the Fed to hold at 3.75-4.00% on October 28 — and all 100 expecting a hike in December, against less than half a month earlier. The market is close to the same price, with CME FedWatch at roughly 17% for October and 82.8% for December. With the Fed in blackout since October 17, here are the five dates that decide the rest of the year, what each one is priced for, and the two directions each can take.
placeholder
Gold Price Analysis Today | Forex Gold Analysis | XAU/USD Analysis - October 23, 2026Get the latest gold price analysis, forex gold insights, and XAU/USD analysis for October 23, 2026. Read on for the details.
Author  Mitrade
Oct 23, Fri
Get the latest gold price analysis, forex gold insights, and XAU/USD analysis for October 23, 2026. Read on for the details.
placeholder
Nasdaq closes at 26,008.86 — 8.9 points above 26,000, and the credit market never blinkedThe Nasdaq Composite fell 2.60% to 26,008.86 on October 22, its worst session since June, as Meta sank 6.98% on 2026 capex guidance of $135–145 billion. But the equal-weight S&P 500 rose 0.73%, high-yield credit was flat and 10-year yields fell 20 basis points. This was an AI de-rating, not a risk-off event — here is the transmission chain, the 29,000 / 28,200 levels and what would prove it wrong.
Author  Irene Q.
Oct 23, Fri
The Nasdaq Composite fell 2.60% to 26,008.86 on October 22, its worst session since June, as Meta sank 6.98% on 2026 capex guidance of $135–145 billion. But the equal-weight S&P 500 rose 0.73%, high-yield credit was flat and 10-year yields fell 20 basis points. This was an AI de-rating, not a risk-off event — here is the transmission chain, the 29,000 / 28,200 levels and what would prove it wrong.
placeholder
Brent tops $113 on Saudi supply risk — but the diesel line in the EIA report is the tellBrent's December contract settled at $113.17 on October 22, up 4.00% and the highest close since May 4, after Saudi Arabia restricted refined-product shipments. The same session's EIA report showed crude stocks down 3.06 million barrels and gasoline down 2.95 million — but distillates built 1.68 million. That single line decides whether $113 holds: here are the data, the 108.8 / 114.0 / 119.3 levels and the two scenarios.
Author  Irene Q.
Oct 23, Fri
Brent's December contract settled at $113.17 on October 22, up 4.00% and the highest close since May 4, after Saudi Arabia restricted refined-product shipments. The same session's EIA report showed crude stocks down 3.06 million barrels and gasoline down 2.95 million — but distillates built 1.68 million. That single line decides whether $113 holds: here are the data, the 108.8 / 114.0 / 119.3 levels and the two scenarios.
placeholder
Gold Price Analysis Today | Forex Gold Analysis | XAU/USD Analysis - October 26, 2026Get the latest gold price analysis, forex gold insights, and XAU/USD analysis for October 26, 2026. Read on for the details.
Author  Mitrade
1 hour ago
Get the latest gold price analysis, forex gold insights, and XAU/USD analysis for October 26, 2026. Read on for the details.
goTop
quote