


WTI (USOIL) Is up 2.17% on Oct 23: What Is Driving the Move?
WTI (USOIL) is up 2.17% at Oct 23 05:40(ET), now at $101.026, with a 7-day up of 2.05%.
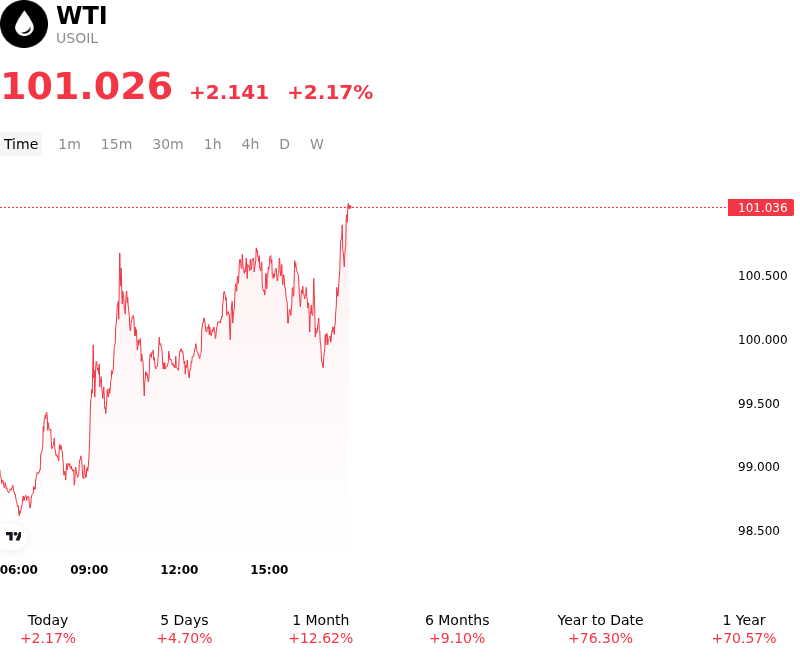
What is driving WTI (USOIL)’s stock price up today?
The advance in West Texas Intermediate crude futures was primarily driven by a sharp escalation of geopolitical friction in the Middle East, which injected a substantial supply-risk premium into global energy markets. Market anxiety mounted following targeted attacks on key regional energy and transport infrastructure, alongside heightened security alerts around major operating facilities in the Gulf. Concurrently, persistent threats to commercial maritime traffic navigating the Strait of Hormuz and intensifying speculation surrounding potential military actions against regional oil infrastructure amplified fears of physical supply curtailments. Given the strategic importance of Middle Eastern export corridors, traders rapidly repriced near-term risk parameters to account for potential disruptions to global crude flows.
Compounding the geopolitical impulse was a distinctly tight domestic supply picture in the United States. Energy Information Administration data highlighted a larger-than-expected drawdown in commercial crude inventories, pushing domestic stocks further below their five-year seasonal average. A parallel contraction in refined product stockpiles, particularly gasoline, reflected steady downstream refinery throughput and resilient end-user consumption. The combination of declining primary crude inventories and robust refining margins reinforced physical market tightness, offering solid fundamental backing to the upward price trajectory.
Market structure and liquidity factors also played a meaningful role in accelerating the upward move. As prices breached critical technical resistance levels and approached key psychological thresholds, systematic trend-following strategies and institutional fund flows triggered automated buying and short-covering activity. Although high borrowing costs and lingering macroeconomic growth concerns continue to pose long-term demand risks, short-term price action remains anchored to physical supply security and Middle Eastern geopolitical developments. Market participants remain focused on potential operational disruptions, regional escalation, and upcoming inventory trends to evaluate the sustainability of this price advance.
Technical Analysis of WTI (USOIL)
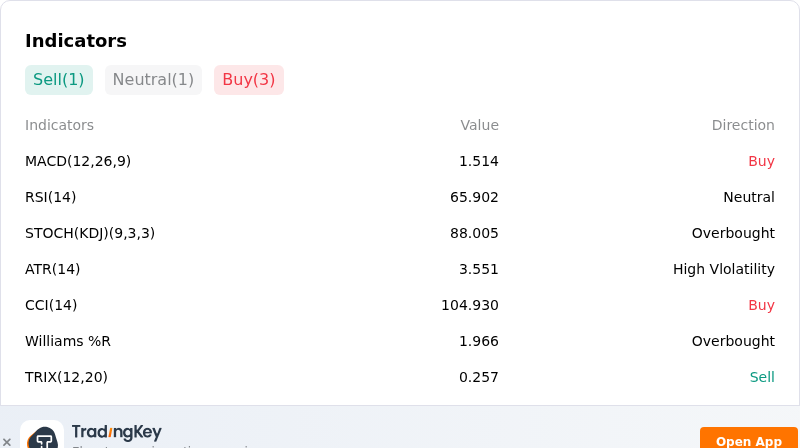
Technically, WTI (USOIL) shows a MACD (12,26,9) value of 1.514, indicating a buy signal. The RSI at 65.902 suggests neutral condition and the Williams %R at 1.966 suggests overbought condition. Please monitor closely.
More details about WTI (USOIL)
Recent Events and Risks:
- Unexpected Distillate Stock Build and Cushing Inventory Accumulation: The latest EIA weekly status report revealed a surprising build of 1.68 million barrels in U.S. distillate inventories alongside a 900,000-barrel stock increase at the Cushing delivery hub, depressing refined product sentiment and dampening intraday upside momentum.
- Rising OPEC+ Supply and Expanding Non-OPEC Production: Saudi Arabia's monthly crude production rose sharply to 8.732 million barrels per day, while expanding non-OPEC output from South America is accelerating medium-term global supply growth, heightening strategist concerns over market oversupply.
- Easing Logistics Disruption Premium and Shipping Normalization: Persian Gulf maritime transportation metrics and bypass pipeline throughput continue to recover toward pre-disruption levels, exposing WTI crude futures to downside pressure from the unwinding of geopolitical risk premiums.
- Medium-Term Global Surplus Projections and Demand Slowdown: Energy market forecasts indicate that overall petroleum supply is on track to outpace global consumption growth, with macro headwinds and slowing industrial demand in major non-OECD regions threatening sustained downside price risk.
Recommended Articles


