


BNB (BNBUSD) Is down 1.03% on Oct 16: Key Drivers to Watch
BNB (BNBUSD) is down 1.03% at Oct 16 12:00(ET), now at $721.2, with a 7-day down of 2.37%.
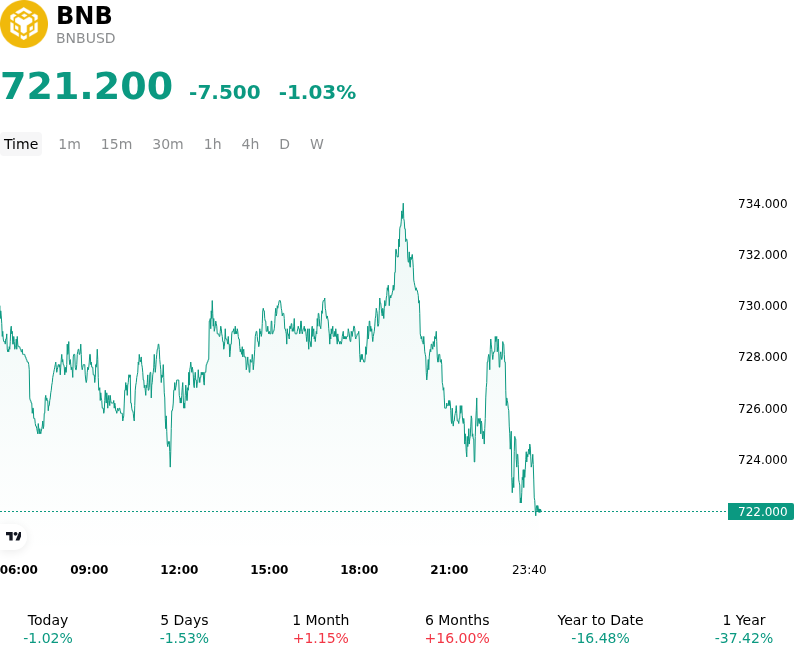
What is driving BNB (BNBUSD)’s stock price down today?
The pullback in BNB reflected a broader repricing of risk assets driven by macroeconomic tightening and shifting digital asset capital flows. Financial markets digested resilient economic data and elevated U.S. Treasury yields, which raised real rates and tightened global liquidity conditions. This environment increased the opportunity cost of holding non-yielding crypto assets, suppressing speculative risk appetite across major altcoins. While market leaders like Bitcoin absorbed selective spot inflows, major ecosystem tokens faced relative weakness as institutional investors adjusted capital allocations toward defensive postures.
Asset-specific dynamics for BNB also contributed to the downward pressure. After testing resistance near major psychological thresholds earlier in the month, BNB encountered localized profit-taking. On-chain metrics and digital asset flow reports indicated modest institutional outflows and shifting stablecoin liquidity away from alternative layer-one ecosystems. Although BNB Chain continues to maintain a strong presence in real-world asset tokenization and off-hours trading volume, short-term spot market demand softened as market participants refrained from aggressive dip-buying amidst macro uncertainty.
From a market structure perspective, the price action was exacerbated by technical liquidations and derivative positioning. The failure to clear key short-term moving averages prompted leveraged long position closures in perpetual futures contracts, creating localized sell pressure. Derivatives traders simultaneously recalibrated probability distributions in prediction markets, scaling back near-term upside expectations and favoring neutral-to-defensive hedging strategies. Consequently, the move represents a liquidity-driven correction fueled by leverage unwinding and broad market consolidation rather than a structural deterioration in network fundamentals.
Technical Analysis of BNB (BNBUSD)
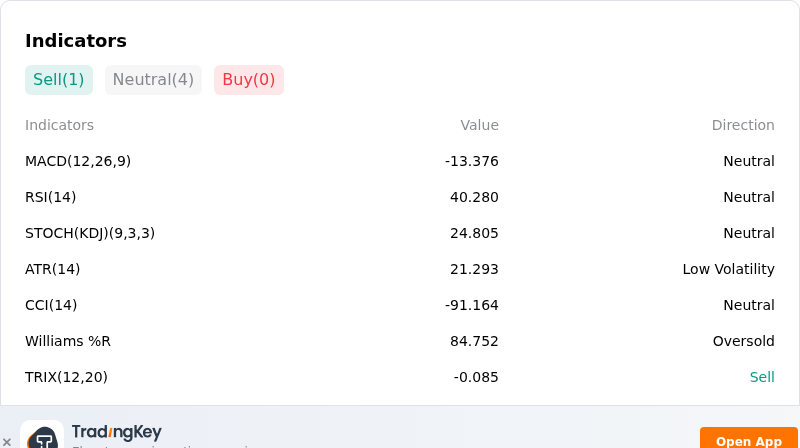
Technically, BNB (BNBUSD) shows a MACD (12,26,9) value of -13.376, indicating a neutral signal. The RSI at 40.280 suggests neutral condition and the Williams %R at 84.752 suggests oversold condition. Please monitor closely.
More details about BNB (BNBUSD)
Recent Events and Risks:
- Whale Exchange Transfers and Direct Sell Pressure: On-chain tracking indicates significant whale wallets transferring thousands of BNB tokens directly onto Binance deposit addresses, signaling imminent liquidation risks as large holders attempt to cut losses amidst broader altcoin market weakness.
- Derivatives Liquidation Cascades and Technical Breakdown: BNB has fallen below key support thresholds near $730, accelerating downside volatility and triggering leveraged long liquidations across futures markets that threaten to push prices toward lower support bounds around $700 and $680.
- Ongoing Regulatory Scrutiny and Exchange Vulnerability: Regulatory friction surrounding Binance's licensing and compliance under international frameworks such as Europe's MiCA continues to suppress investor confidence, exacerbating the token's vulnerability to negative exchange-related legal headlines.
- Macro Risk-Off Sentiment and Declining Liquidity: Persistent macro headwinds—including elevated U.S. Treasury yields and stubborn inflation concerns—have reduced broader market liquidity and depressed institutional inflows, leaving altcoins like BNB exposed to prolonged selling pressure.
Recommended Articles


