


Thermo Fisher Scientific Inc Stock (TMO) Moved Up by 3.21% on Oct 15: What Investors Need To Know
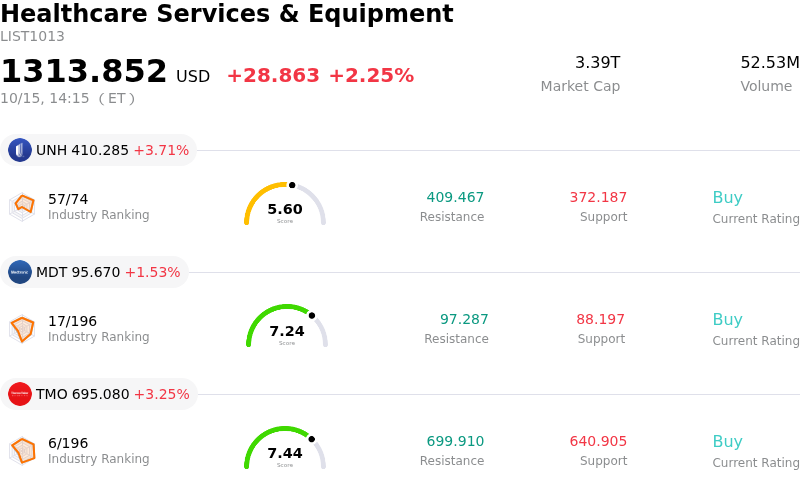
Thermo Fisher Scientific Inc (TMO) moved up by 3.21%. The Healthcare Services & Equipment sector is up by 2.25%. The company outperformed the industry. Top 3 stocks by turnover in the sector: Unitedhealth Group Inc (UNH) up 3.71%; Medtronic PLC (MDT) up 1.54%; Thermo Fisher Scientific Inc (TMO) up 3.23%.
What is driving Thermo Fisher Scientific Inc (TMO)’s stock price up today?
Thermo Fisher Scientific experienced notable intraday volatility and strong upward price momentum as market participants actively positioned themselves ahead of the company's upcoming quarterly earnings release. Investor expectations have been building around sustained momentum in life sciences research, steady demand across bioproduction channels, and continued strength in clinical research services. Wall Street consensus projects solid year-over-year top-line and bottom-line growth, supported by the company's consistent track record of exceeding quarterly earnings estimates. This pre-earnings positioning, combined with broad-based interest in life sciences tools, served as a primary driver for elevated trading volume.
Fundamentals remain reinforced by ongoing technological innovations and strategic portfolio execution. Recent product rollouts across the Life Sciences Solutions segment, alongside expanded distribution agreements for advanced mass spectrometry platforms and proteomics workflows, continue to bolster confidence in commercial execution. Furthermore, portfolio optimization efforts—including the strategic divestiture of non-core operations—have sharpened operational focus toward higher-margin biomanufacturing and pharmaceutical services, where customer spending among biopharma clients continues to show resilient underlying demand.
From a strategy perspective, constructive sell-side analyst commentary and positive target price revisions from major research institutions have served as catalysts for institutional buying. Institutional portfolio managers appear to be rotating back into high-quality healthcare growth names that offer balance sheet strength and stable end-market demand. While elevated intraday price swings reflect market sensitivity and positioning dynamic leading into the reporting date, the overall price action reflects positive sentiment surrounding Thermo Fisher's market leadership in scientific instruments and bioprocessing solutions.
Technical Analysis of Thermo Fisher Scientific Inc (TMO)
Technically, Thermo Fisher Scientific Inc (TMO) shows a MACD (12,26,9) value of -0.808, indicating a neutral signal. The RSI at 67.054 suggests neutral condition and the Williams %R at 0.584 suggests overbought condition. Please monitor closely.
Fundamental Analysis of Thermo Fisher Scientific Inc (TMO)
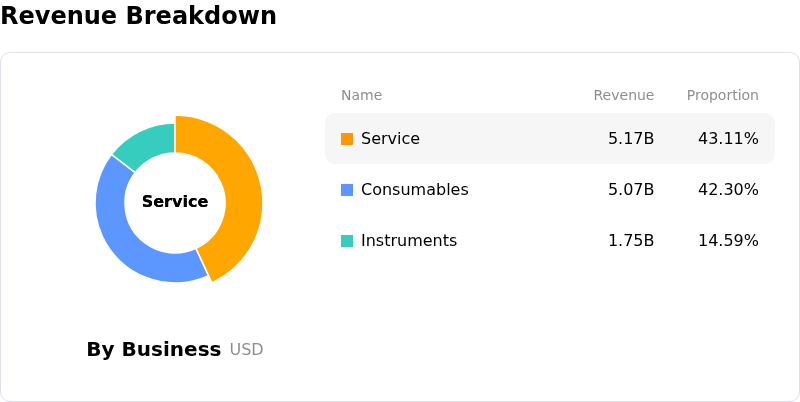
Thermo Fisher Scientific Inc (TMO) is in the Healthcare Services & Equipment industry. Its latest annual revenue is $44.56B, ranking 2 in the industry. The net profit is $6.70B, ranking 1 in the industry. Company Profile
Over the past month, multiple analysts have rated the company as Buy, with an average price target of $683.61, a high of $800.00, and a low of $553.65.
More details about Thermo Fisher Scientific Inc (TMO)
Company Specific Risks:
- Pre-Earnings Valuation and Downside Vulnerability: Trading near 52-week highs with a price-to-earnings multiple exceeding 36x ahead of its scheduled Q3 earnings release, the equity faces heightened intraday volatility as elevated valuation metrics leave zero room for potential guidance cuts or revenue misses.
- Substantial Insider Capital Liquidations: Institutional equity analysts have flagged concern regarding executive stock divestments, where key corporate officers—including the Chief Executive Officer—have liquidated approximately $44.1 million in shares, potentially signaling cautious internal visibility on near-term growth trajectories.
- Segment Margin Compression in Analytical Instruments: Core diagnostic and scientific tool divisions show operational weakness, underscored by a recent 300-basis-point drop in Analytical Instruments segment margins down to 20.7%, reflecting high exposure to lumpy customer capital expenditures.
- CDMO Asset Utilization and Bioprocessing Lag: Institutional research highlights persistent headwinds across contract development and manufacturing organization (CDMO) operations, where lower bioprocessing exposure relative to life-science peers and capacity underutilization threaten sustained organic top-line acceleration.
Recommended Articles


