

XRP (XRPUSD) Is down 3.85% on Sep 27: What Do On-Chain Data and Market Sentiment Show?

Source Tradingkey

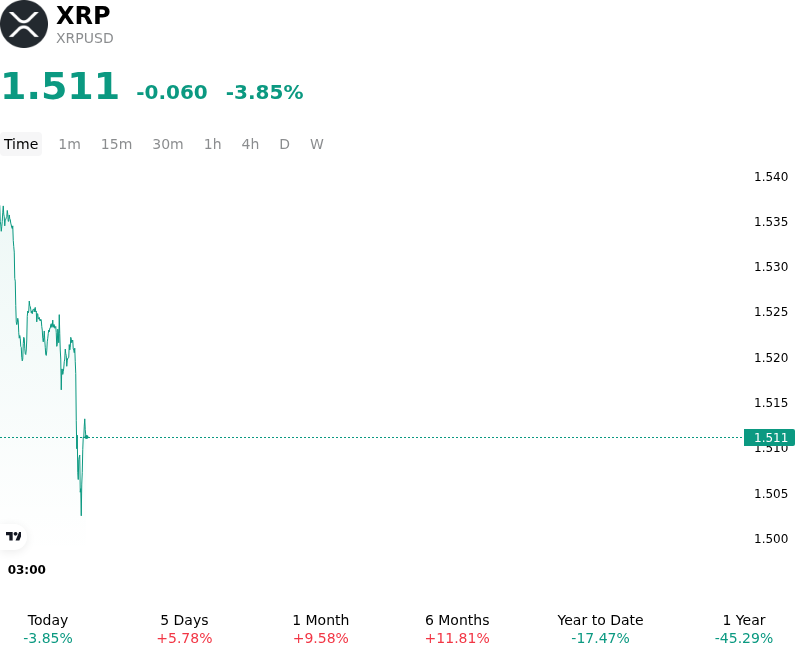
XRP (XRPUSD) is down 3.85% at Sep 27 20:55(ET), now at $1.5112, with a 7-day up of 7.48%.
SummaryOverview

What is driving XRP (XRPUSD)’s stock price down today?

The pullback in XRP reflected a wave of tactical profit-taking and technical rejection following a sharp multi-day advance toward key multi-month resistance levels. As the token approached heavily traded overhead supply zones, institutional and retail sellers locked in gains from the recent rally, capping upward momentum. This shift in order book dynamics triggered profit-taking among short-term paper, leading to momentum deceleration and a modest unwinding of leveraged long positions in the derivatives market.

Compounding the intraday downward friction was market anticipation surrounding the upcoming monthly token release window from Ripple's escrow holdings, which temporarily altered short-term supply-demand expectations. Although spot XRP exchange-traded funds and institutional investment products continued to absorb baseline supply over longer horizons, secondary market liquidity faced renewed macro headwinds. Firm US Treasury yields and general risk-off positioning across broader crypto and legacy asset markets constrained aggressive dip-buying, preventing market makers from sustaining higher price levels.

Additionally, minor sentiment friction stemming from security exploits on centralized trading platforms added a layer of immediate caution, encouraging market participants to temporarily de-risk derivatives exposure. Despite this intraday decline, on-chain metrics indicate that long-term wallet accumulation and spot ETF assets under management remain relatively resilient. The price contraction appears to be a typical leverage reset and liquidity-driven rebalancing within a broader consolidation framework, rather than a structural shift in the asset's medium-term institutional adoption trajectory.

Technical Analysis of XRP (XRPUSD)

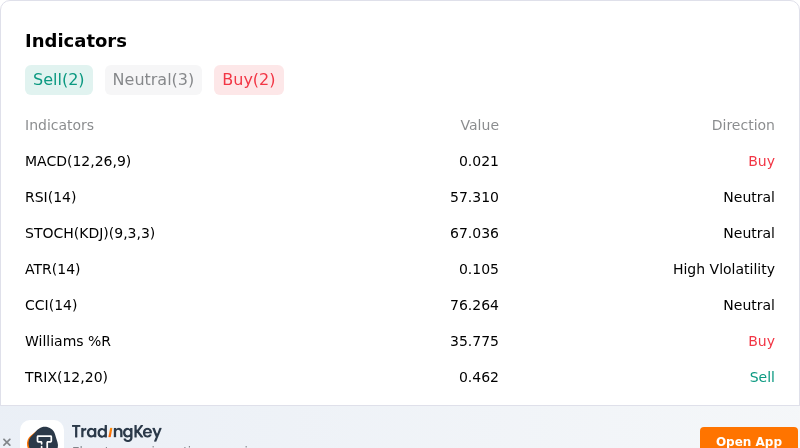
Technically, XRP (XRPUSD) shows a MACD (12,26,9) value of 0.021, indicating a buy signal. The RSI at 57.310 suggests neutral condition and the Williams %R at 35.775 suggests buy condition. Please monitor closely.
IndicatorAnalysis

More details about XRP (XRPUSD)

Recent Events and Risks:

  • Regulatory Legislative Defeat: The U.S. Senate's failure to pass procedural cloture on the CLARITY Act removed near-term expectations for statutory classification of XRP as a digital commodity under CFTC jurisdiction, reigniting regulatory uncertainty.
  • Technical Resistance Rejection and Double-Top Setup: Repeated rejections at the key $1.60–$1.65 overhead resistance zone have fueled intraday profit-taking, increasing technical double-top breakdown risks toward lower support around $1.45–$1.28.
  • Surge in Exchange-Bound Whale Deposits: On-chain data indicates large-scale whale deposits onto central exchange order books, expanding liquid supply and reinforcing overhead resistance near key breakout levels.
  • Derivatives Unwinding and Liquidation Fragility: Sharp technical pullbacks have triggered significant long derivative liquidations, leaving remaining leverage vulnerable to additional downside cascading risks if secondary support fails to hold.
Disclaimer: For information purposes only. Past performance is not indicative of future results.
placeholder
October hike odds climb toward 60% as Goldman and BofA both flip — what Warsh's "dose of accommodation" really changedRate futures now price roughly 55% to 62% for a 25bp hike at the October 27-28 FOMC, up from about 30% before Chair Warsh's post-meeting framing that the Fed is merely "removing some accommodation." Goldman Sachs has added an October hike to its forecast and Bank of America now sees moves in both October and December. Here is the repricing, the language behind it, and the two data points that decide it.
Author  Irene Q.
Sep 23, Wed
Rate futures now price roughly 55% to 62% for a 25bp hike at the October 27-28 FOMC, up from about 30% before Chair Warsh's post-meeting framing that the Fed is merely "removing some accommodation." Goldman Sachs has added an October hike to its forecast and Bank of America now sees moves in both October and December. Here is the repricing, the language behind it, and the two data points that decide it.
placeholder
Memory chips surge, Nasdaq notches a second straight record close — why the Dow fell 185 points anywayMicron gained 5%, SanDisk 6.8%, Seagate 4% and Western Digital 3% as the memory complex led the Nasdaq Composite to a second consecutive record close of 27,244.28. But the Dow fell 185 points as JPMorgan, Wells Fargo and Schwab slid more than 3% each — a split tape that says more about positioning than about the economy.
Author  Irene Q.
Sep 23, Wed
Micron gained 5%, SanDisk 6.8%, Seagate 4% and Western Digital 3% as the memory complex led the Nasdaq Composite to a second consecutive record close of 27,244.28. But the Dow fell 185 points as JPMorgan, Wells Fargo and Schwab slid more than 3% each — a split tape that says more about positioning than about the economy.
placeholder
US input costs rose at the fastest pace in four years — the September flash PMI beat is an inflation story, not a growth storyUS September flash PMIs came in far above expectations, with the composite at 58.4, a five-year high. But the detail that moved markets was input cost inflation at its fastest since October 2022, driven by fuel, transport and supply shortages. Brent is back above $100 and the 10-year Treasury yield has hit its highest since 2007.
Author  Suzie
Sep 24, Thu
US September flash PMIs came in far above expectations, with the composite at 58.4, a five-year high. But the detail that moved markets was input cost inflation at its fastest since October 2022, driven by fuel, transport and supply shortages. Brent is back above $100 and the 10-year Treasury yield has hit its highest since 2007.
placeholder
Gold Price Forecast: Gold Drops Below $4,300, Will It Continue to Fall? As of the European session on September 24, gold prices (XAUUSD) extended their correction, dipping below $4,300 intraday to hit a low of $4,262.45. After previously rebounding close to $
Author  TradingKey
Sep 24, Thu
As of the European session on September 24, gold prices (XAUUSD) extended their correction, dipping below $4,300 intraday to hit a low of $4,262.45. After previously rebounding close to $
placeholder
WTI (USOIL) Is down 2.03% on Sep 25: Here Is WhyWTI (USOIL) is down 2.03% at Sep 24 22:20(UTC+0), now at $92.517, with a 7-day down of 3.63%.What is driving WTI (USOIL)’s stock price down today?The drop in WTI crude oil prices was primarily driven by
Author  TradingKey
Sep 25, Fri
WTI (USOIL) is down 2.03% at Sep 24 22:20(UTC+0), now at $92.517, with a 7-day down of 3.63%.What is driving WTI (USOIL)’s stock price down today?The drop in WTI crude oil prices was primarily driven by
goTop
quote