

Ethereum (ETHUSD) Is up 1.05% on Sep 25: What Do On-Chain Data and Market Sentiment Show?

Source Tradingkey

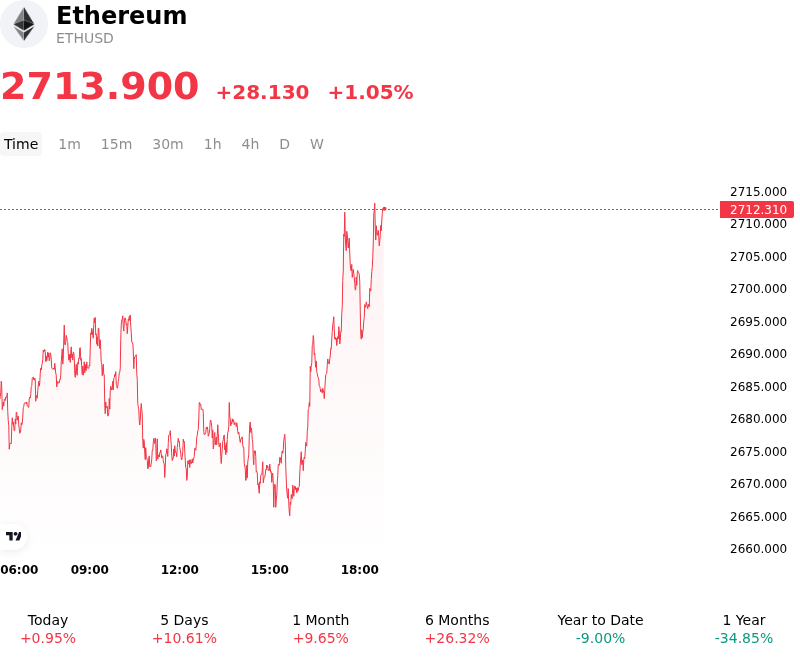
Ethereum (ETHUSD) is up 1.05% at Sep 25 06:50(ET), now at $2713.9, with a 7-day up of 3.21%.
SummaryOverview

What is driving Ethereum (ETHUSD)’s stock price up today?

Capital flowed into Ethereum as renewed institutional demand, positive spot ETF activity, and key technical momentum combined to lift market sentiment. The advance was primarily anchored by sustained spot exchange-traded fund inflows, which provided consistent institutional bid support during the trading session. As Ethereum cleared critical overhead resistance near key moving average clusters, automated momentum strategies and spot accumulation accelerated. Improved risk appetite across broader digital asset markets further incentivized allocators to expand exposure to high-beta Layer-1 assets.

Derivatives market dynamics played a supportive role in reinforcing the upward price action. A moderate buildup in futures open interest alongside positive funding rates signaled expanding long positioning among institutional market participants. The initial push above local resistance triggered selective short covering, clearing overhead leverage and creating a favorable liquidity environment for buyers. On-chain activity reflected stable network utilization, driven by ongoing Layer-2 rollup settlement and steady decentralised finance volume, which reinforced underlying value-accrual expectations.

From a structural perspective, the move reflects a strengthening recovery trend supported by institutional capital flows rather than an isolated speculative event. While the immediate market posture remains constructive, institutional investors continue to monitor broader macroeconomic variables, particularly U.S. Treasury yield volatility and global liquidity conditions, alongside spot volume depth required to absorb overhead supply at higher key resistance levels.

Technical Analysis of Ethereum (ETHUSD)

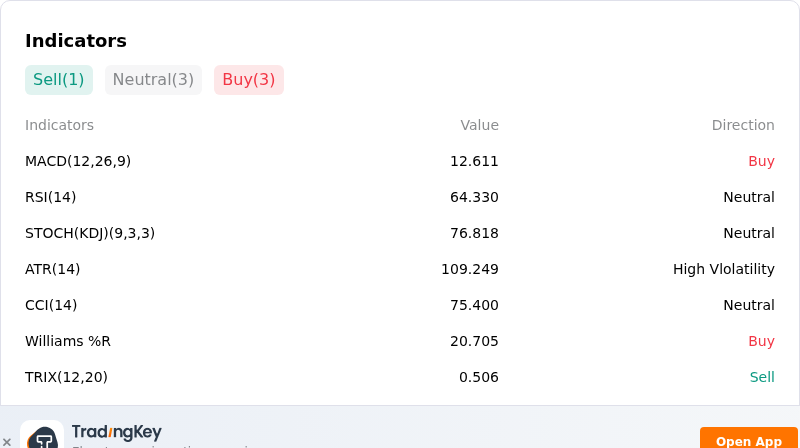
Technically, Ethereum (ETHUSD) shows a MACD (12,26,9) value of 12.611, indicating a buy signal. The RSI at 64.330 suggests neutral condition and the Williams %R at 20.705 suggests buy condition. Please monitor closely.
IndicatorAnalysis

More details about Ethereum (ETHUSD)

Recent Events and Risks:

  • Derivatives Leverage Unwinding & Long Liquidations: An intraday price pullback from $2,788 to $2,635 triggered over $96 million in forced ETH long liquidations, underscoring high market vulnerability to leverage unwinds and liquidation cascades if support at $2,540 gives way.
  • Whale Offloading & Rising Exchange Deposits: On-chain transaction tracking revealed large-scale whale distribution, including a single OTC holder liquidating 42,005 ETH ($111.89 million), while exchange netflows surged back into positive territory (+10.6k ETH) to increase immediate overhead selling pressure.
  • Macro Risk-Off Sentiment & Yield Spikes: Broad financial market weakness driven by hawkish interest rate expectations and climbing US Treasury yields has dampened risk appetite across digital assets, exacerbating selling pressure across major liquid trading pairs.
  • Regulatory Stalls & Spot ETF Flow Friction: Legislative uncertainty following the procedural failure of the CLARITY Act to advance in the U.S. Senate, coupled with choppy institutional spot ETF flows, continues to restrict sustainable buy-side momentum.
Disclaimer: For information purposes only. Past performance is not indicative of future results.
placeholder
WTI (USOIL) Is down 2.03% on Sep 25: Here Is WhyWTI (USOIL) is down 2.03% at Sep 24 22:20(UTC+0), now at $92.517, with a 7-day down of 3.63%.What is driving WTI (USOIL)’s stock price down today?The drop in WTI crude oil prices was primarily driven by
Author  TradingKey
12 hours ago
WTI (USOIL) is down 2.03% at Sep 24 22:20(UTC+0), now at $92.517, with a 7-day down of 3.63%.What is driving WTI (USOIL)’s stock price down today?The drop in WTI crude oil prices was primarily driven by
placeholder
Silver Price Forecast: XAG/USD remains steady near $64.00 as oil prices easeSilver price (XAG/USD) inches higher after two days of losses, trading around $63.90 per troy ounce during Asian hours on Friday. Non-yielding Silver is finding underlying support as inflation concerns ease following a pullback in crude oil prices.
Author  FXStreet
13 hours ago
Silver price (XAG/USD) inches higher after two days of losses, trading around $63.90 per troy ounce during Asian hours on Friday. Non-yielding Silver is finding underlying support as inflation concerns ease following a pullback in crude oil prices.
placeholder
Gold Price Forecast: Gold Drops Below $4,300, Will It Continue to Fall? As of the European session on September 24, gold prices (XAUUSD) extended their correction, dipping below $4,300 intraday to hit a low of $4,262.45. After previously rebounding close to $
Author  TradingKey
Yesterday 09: 57
As of the European session on September 24, gold prices (XAUUSD) extended their correction, dipping below $4,300 intraday to hit a low of $4,262.45. After previously rebounding close to $
placeholder
Yen touches 158.37 as Tokyo reopens, then slips back — ¥15.4 trillion of intervention and the 200-day line stand between here and 160USD/JPY reached 158.37 overnight, its highest since early September, then eased to 157.88 as Japanese markets reopened after a three-day holiday. The Ministry of Finance has spent ¥15.4 trillion defending the yen since late July and the BOJ ran a rate check on September 18. The 200-day average sits at 158.43.
Author  Irene Q.
Yesterday 06: 59
USD/JPY reached 158.37 overnight, its highest since early September, then eased to 157.88 as Japanese markets reopened after a three-day holiday. The Ministry of Finance has spent ¥15.4 trillion defending the yen since late July and the BOJ ran a rate check on September 18. The 200-day average sits at 158.43.
placeholder
US input costs rose at the fastest pace in four years — the September flash PMI beat is an inflation story, not a growth storyUS September flash PMIs came in far above expectations, with the composite at 58.4, a five-year high. But the detail that moved markets was input cost inflation at its fastest since October 2022, driven by fuel, transport and supply shortages. Brent is back above $100 and the 10-year Treasury yield has hit its highest since 2007.
Author  Suzie
Yesterday 06: 46
US September flash PMIs came in far above expectations, with the composite at 58.4, a five-year high. But the detail that moved markets was input cost inflation at its fastest since October 2022, driven by fuel, transport and supply shortages. Brent is back above $100 and the 10-year Treasury yield has hit its highest since 2007.
goTop
quote