


BNB (BNBUSD) Is down 1.03% on Sep 25: What Are the Risk Factors?
BNB (BNBUSD) is down 1.03% at Sep 25 23:20(ET), now at $769.5, with a 7-day up of 1.02%.
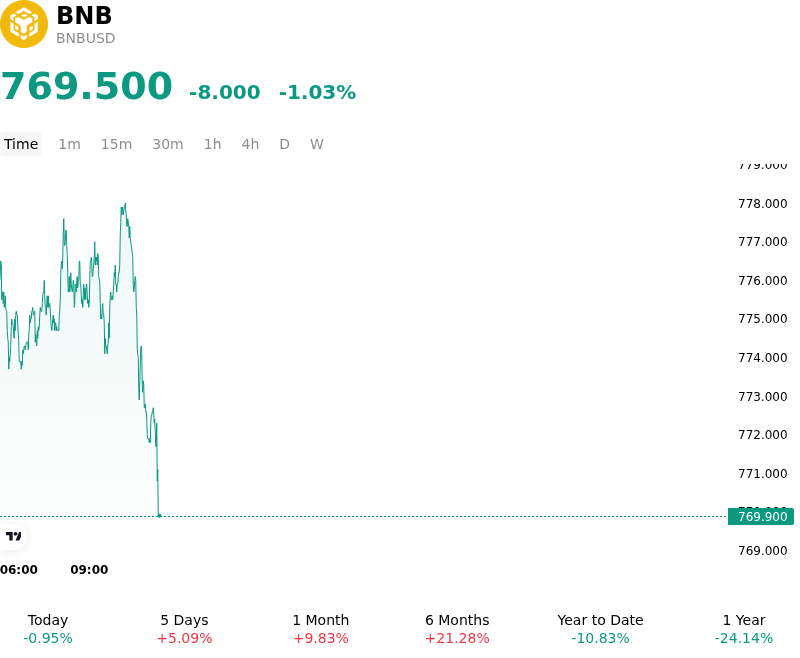
What is driving BNB (BNBUSD)’s stock price down today?
The moderate pullback in BNB reflects a combination of short-term profit-taking near psychological resistance levels and market digestion of structural changes within the Binance exchange ecosystem. After testing the key resistance threshold near the $800 level following strong multi-week upside, capital flows stalled as traders locked in gains and rebalanced risk exposure. The profit-taking was accelerated by Binance’s formal announcement regarding a major account migration, which transitions non-stock cryptocurrency balances from Funding Accounts to Spot Accounts in preparation for an equity trading infrastructure rollout. Although BNB remains explicitly designated as a core settlement asset for the platform's upcoming stock and options architecture, the administrative and technical adjustments prompted temporary liquidity realignments among active market participants.
In derivatives markets, open interest softened as long positioning unwound near recent cycle highs. The modest decline was accompanied by a normalization in funding rates, signaling that speculative leverage was flushed out without triggering cascading systemic liquidations. While broader tailwinds around BNB Chain’s real-world asset expansion and recent protocol upgrades continue to bolster long-term fundamental sentiment, short-term liquidity conditions were constrained by cautious capital deployment across altcoins. Institutional investors remain focused on observing how the exchange's structural account migration impacts trading velocity and spot liquidity across major pairs leading into the execution phase.
From a broader macro and risk perspective, BNB’s performance remains intertwined with broader digital asset market liquidity and global monetary policy expectations. With major crypto assets consolidating after recent gains, risk appetite for exchange-linked tokens has paused as traders assess broader macroeconomic indicators and Federal Reserve policy expectations. Key risks monitored by market participants include potential execution friction during the account migration, broader regulatory scrutiny surrounding centralized exchange product expansions, and overall shifts in global risk sentiment. Absent fresh macro or ecosystem catalysts, BNB is likely to undergo short-term consolidation as liquidity settles into spot venues.
Technical Analysis of BNB (BNBUSD)
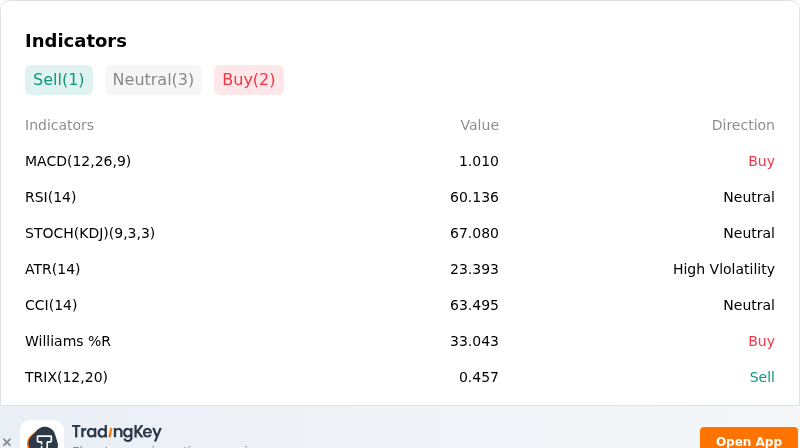
Technically, BNB (BNBUSD) shows a MACD (12,26,9) value of 1.010, indicating a buy signal. The RSI at 60.136 suggests neutral condition and the Williams %R at 33.043 suggests buy condition. Please monitor closely.
More details about BNB (BNBUSD)
Recent Events and Risks:
- Renewed Regulatory Investigation Overhang: Federal prosecutors opened a fresh investigation into Binance concerning potential Iran sanctions violations involving over $100 million in transaction flows. With Binance operating under a mandatory three-year compliance monitor from its prior settlement, any findings of non-compliance introduce significant legal escalation risk and sentiment drag on BNB.
- Account Migration & Liquidity Friction: Binance announced a structural migration beginning September 29, 2026, which halts direct on-chain crypto deposits into Funding Accounts and forcibly reallocates non-stock assets to Spot Accounts. This mandatory transition creates short-term operational uncertainty and potential liquidity fragmentation across exchange trading routes.
- Technical Resistance Rejection: BNB suffered an intraday rejection near the key $800 psychological threshold and weekly resistance around $806–$823, pushing prices back toward primary support near $750–$760. Cool-downs in short-term RSI and MACD metrics point to weakening buying momentum and potential retests of lower support levels down to $739.
- Macro Volatility & Leverage Unwinding Risk: Persistently high bond yields and broader equity market weakness continue to weigh on digital asset liquidity. A broader risk-off shift in crypto market sentiment leaves BNB exposed to long liquidations and forced leverage unwinds if broader altcoin weakness persists.
Recommended Articles


