


WTI Futures (USOIL-F) Is down 2.04% on Sep 25: Is the Market Repricing It?
WTI Futures (USOIL-F) is down 2.04% at Sep 25 23:10(ET), now at $92.78, with a 7-day down of 2.75%.
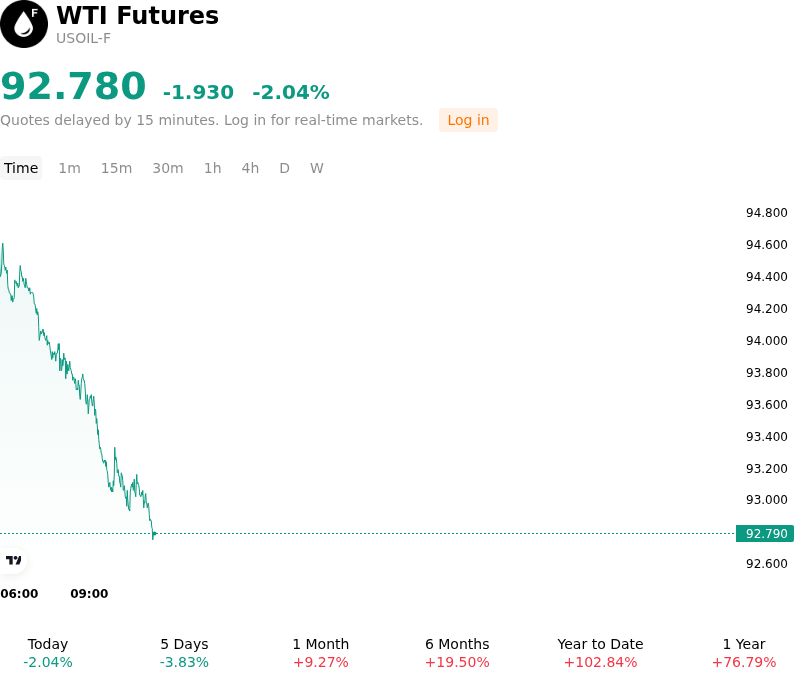
What is driving WTI Futures (USOIL-F)’s stock price down today?
Crude oil prices turned lower as geopolitical risk premiums eased following reported progress in diplomatic discussions between the United States and Iran aimed at restoring maritime transit through the Strait of Hormuz. Hopes for a structured agreement to alleviate shipping bottlenecks in the Persian Gulf led market participants to price in a reduction of potential supply disruptions, prompting long liquidation across energy futures. The prospect of normalized regional crude flows effectively offset immediate geopolitical supply fears stemming from recent military friction in the Middle East.
Reinforcing the downward momentum was the lingering impact of recent U.S. Energy Information Administration inventory data, which highlighted a surprising build in domestic commercial crude stockpiles. The unexpected rise in crude inventories, accompanied by an accumulation of stocks at the Cushing, Oklahoma storage hub, underscored softening near-term physical crude demand from domestic refiners. Reduced refinery runs and lower capacity utilization rates further exacerbated domestic supply overhang expectations, preventing buyers from aggressively stepping in to support prices.
From a positioning standpoint, institutional capital flows reflected profit-taking and momentum unwinding after several volatile sessions dominated by conflicting geopolitical headlines. While broader structural supply constraints and historical inventory drawdowns continue to anchor long-term valuation floors, traders prioritized risk-off positioning ahead of macro data and further diplomatic clarity. Institutional investors remain focused on whether diplomatic channels will yield a durable reduction in regional shipping risks or if ongoing production constraints will re-tighten the global balance entering the final quarter of the year.
Technical Analysis of WTI Futures (USOIL-F)
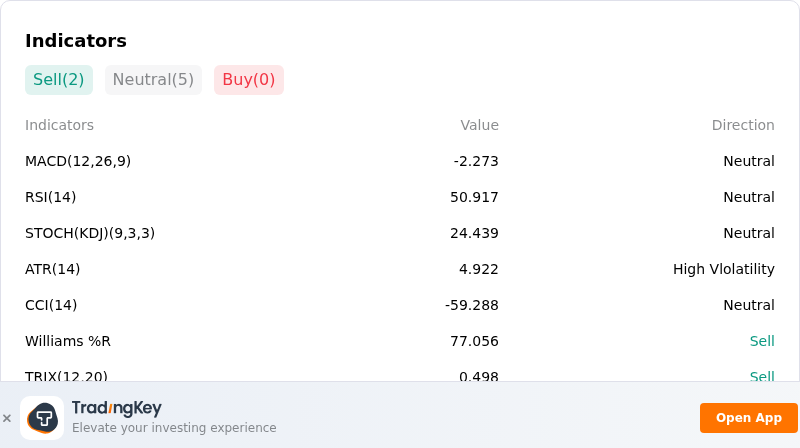
Technically, WTI Futures (USOIL-F) shows a MACD (12,26,9) value of -2.273, indicating a neutral signal. The RSI at 50.917 suggests neutral condition and the Williams %R at 77.056 suggests sell condition. Please monitor closely.
More details about WTI Futures (USOIL-F)
Recent Events and Risks:
- Unexpected U.S. Commercial Crude Stock Builds: The latest Energy Information Administration (EIA) weekly report showed U.S. commercial crude oil inventories rose by 3.0 million barrels to 426.4 million barrels, missing market consensus for a draw and creating immediate downward pressure on WTI benchmark prices.
- Cushing Storage Accumulation: Crude oil stockpiles at the Cushing, Oklahoma delivery hub surged by 2.2 million barrels in a single week, pointing to localized supply gluts and pressuring near-term WTI calendar spreads.
- Easing Geopolitical Risk Premium: Emerging reports of U.S.-Iran diplomatic talks regarding the reopening of the Strait of Hormuz, combined with partial Saudi export flow restorations, prompted sharp intraday profit-taking and an unwinding of geopolitical risk premiums.
- Refinery Maintenance and Demand Slump: U.S. refinery crude processing dropped by 519,000 barrels per day as facility utilization fell to 94% amid seasonal autumn turnaround, weakening domestic spot crude intake and compounding broader macroeconomic demand concerns.
Recommended Articles


