


Aurora Innovation Inc Stock (AUR) Moved Down by 8.78% on Sep 24: What Investors Need To Know
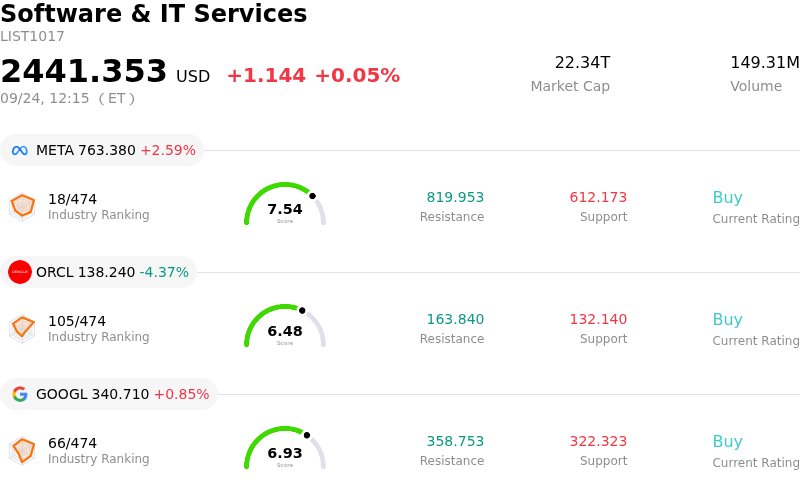
Aurora Innovation Inc (AUR) moved down by 8.78%. The Software & IT Services sector is up by 0.05%. The company underperformed the industry. Top 3 stocks by turnover in the sector: Meta Platforms Inc (META) up 2.44%; Oracle Corp (ORCL) down 4.67%; Alphabet Inc Class A (GOOGL) up 0.75%.
What is driving Aurora Innovation Inc (AUR)’s stock price down today?
Aurora Innovation experienced notable downside volatility following its high-profile Analyst and Investor Day event. Ahead of the conference, market expectations had risen sharply, bolstered by bullish Wall Street research notes and tactical trading recommendations. Management presented major multi-year commercial milestones, including plans to scale its fleet to tens of thousands of autonomous trucks by the end of the decade and transition toward an asset-light Driver-as-a-Service business model. However, because market participants had heavily pre-traded these anticipated operational disclosures, the long-term execution roadmap failed to deliver immediate commercial catalysts, triggering a classic sell-the-news profit-taking response.
Beyond event-driven profit-taking, persistent fundamental overhangs continue to restrain investor enthusiasm. Aurora remains in an early commercialization phase defined by heavy ongoing research and development expenditures, substantial quarterly net operating losses, and a very limited revenue base. While the balance sheet retains a solid liquidity buffer to support ongoing operations and hardware integration partners, the stock's elevated valuation multiple leaves it especially sensitive to repricing when cash flow inflection points remain several years in the future.
Supply-side headwinds and broader market conditions have added further downward pressure. Major corporate insiders and legacy investors, including Uber, have been systematically trimming large equity stakes through block sales, creating persistent structural overhead for the share price. Concurrently, broader technology sector softness and risk-averse sentiment across equity markets have disproportionately impacted high-beta, pre-profitability growth companies, leading institutional investors to reduce exposure to speculative autonomous vehicle technology.
Technical Analysis of Aurora Innovation Inc (AUR)
Technically, Aurora Innovation Inc (AUR) shows a MACD (12,26,9) value of -0.038, indicating a neutral signal. The RSI at 39.050 suggests neutral condition and the Williams %R at 98.492 suggests oversold condition. Please monitor closely.
Fundamental Analysis of Aurora Innovation Inc (AUR)
Aurora Innovation Inc (AUR) is in the Software & IT Services industry. Its latest annual revenue is $3.00M, ranking 545 in the industry. The net profit is $-816.00M, ranking 600 in the industry. Company Profile
Over the past month, multiple analysts have rated the company as Buy, with an average price target of $12.30, a high of $18.00, and a low of $6.00.
More details about Aurora Innovation Inc (AUR)
Company Specific Risks:
- Investor Day Target Disappointment: Shares dropped significantly following the September 2026 Analyst and Investor Day as long-term financial targets—including 30,000 driverless trucks and $5 billion in revenue by 2030—failed to satisfy elevated investor expectations for near-term commercial monetization.
- Persistent Major Shareholder Equity Sales: Ongoing equity stake reductions by key early backer Uber, coupled with over $600 million in quarterly insider share sales, have created sustained technical overhead and selling pressure on the stock.
- Severe Cash Burn and Valuation Disconnect: Aurora continues to post deep quarterly net losses of approximately $270 million against just $2 million in quarterly revenue, generating an extreme price-to-sales ratio exceeding 1,300x that amplifies downside volatility.
- Autonomous Safety and Regulatory Vulnerabilities: Heightened market concerns regarding broad autonomous vehicle safety risks and strict potential regulatory scrutiny pose execution risks as the company attempts to ramp up its driverless fleet deployment.
Recommended Articles


