


Dell Technologies Inc Stock (DELL) Moved Down by 3.19% on Sep 24: Drivers Behind the Movement
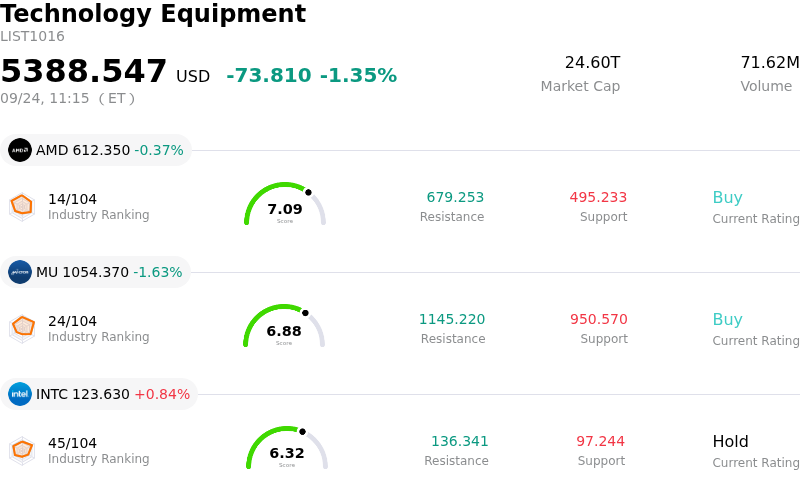
Dell Technologies Inc (DELL) moved down by 3.19%. The Technology Equipment sector is down by 1.35%. The company underperformed the industry. Top 3 stocks by turnover in the sector: Advanced Micro Devices Inc (AMD) down 0.37%; Micron Technology Inc (MU) down 1.56%; Intel Corp (INTC) up 0.87%.
What is driving Dell Technologies Inc (DELL)’s stock price down today?
Dell Technologies experienced downward pressure as investors engaged in tactical profit-taking following a substantial multi-week rally driven by strong quarterly earnings and artificial intelligence server order momentum. With shares trading near all-time highs and valuation multiples expanded well beyond historical averages, market sentiment has become increasingly sensitive to near-term industry headwinds, prompting institutional accounts to lock in capital gains.
A primary catalyst for the pullback stems from cautious revisions regarding the broader hardware ecosystem and memory component cost dynamics. Wall Street analysts have highlighted mounting cost inflation across DRAM and NAND flash memory, which threatens to elevate finished-goods pricing and delay enterprise personal computer refresh cycles. Furthermore, concerns remain focused on margin dilution within the Infrastructure Solutions Group. While demand for high-performance AI infrastructure remains robust, the revenue mix leans heavily toward high-cost component configurations that carry lower gross margins relative to traditional enterprise storage and server offerings.
Market sentiment was further weighed down by recent corporate disclosures regarding insider transactions and capital structure adjustments. Disclosures of insider stock sales by corporate executives and major private equity affiliates near multi-year peak levels generated incremental overhead pressure. At the same time, investors digested recent multi-billion-dollar senior bond offerings intended to refinance maturing debt, which incrementally raises long-term interest expenses during a potential hardware cycle normalization. Despite Dell maintaining a deep AI order backlog and strong long-term structural positioning in enterprise IT infrastructure, the combination of hardware cost inflation, valuation discipline, and institutional portfolio adjustments drove today's price decline.
Technical Analysis of Dell Technologies Inc (DELL)
Technically, Dell Technologies Inc (DELL) shows a MACD (12,26,9) value of -3.984, indicating a neutral signal. The RSI at 53.207 suggests neutral condition and the Williams %R at 71.533 suggests sell condition. Please monitor closely.
Media Coverage of Dell Technologies Inc (DELL)
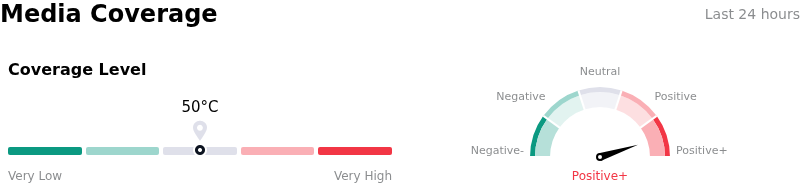
In terms of media coverage, Dell Technologies Inc (DELL) shows a coverage score of 50, indicating a moderate level of media attention. The overall market sentiment index is currently in extremely bullish zone.
Fundamental Analysis of Dell Technologies Inc (DELL)
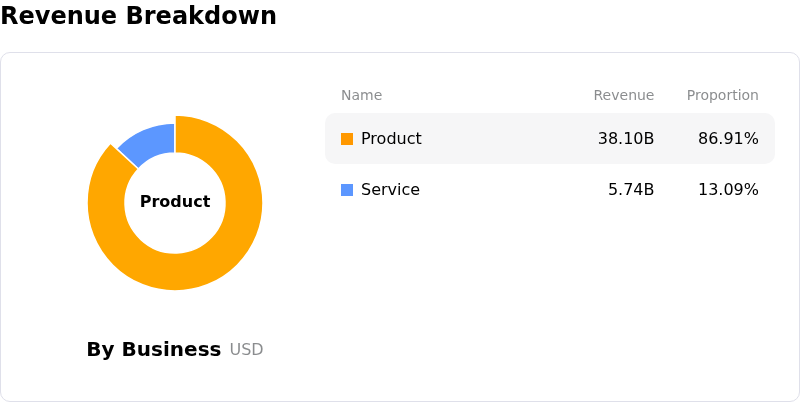
Dell Technologies Inc (DELL) is in the Technology Equipment industry. Its latest annual revenue is $113.54B, ranking 2 in the industry. The net profit is $5.94B, ranking 4 in the industry. Company Profile
Over the past month, multiple analysts have rated the company as Buy, with an average price target of $578.08, a high of $700.00, and a low of $480.00.
More details about Dell Technologies Inc (DELL)
Company Specific Risks:
- AI Server Margin Compression: Rapid volume growth in AI-optimized server deployments within the Infrastructure Solutions Group carries lower gross margins than traditional hardware, stoking institutional analyst concerns that the shifting product mix and rising DRAM and NAND memory chip costs will dilute overall corporate profitability.
- Increased Financial Debt and Interest Expense: SEC Form 8-K filings detail a $5.0 billion public debt offering of senior unsecured notes with coupons up to 5.90%, increasing long-term financial leverage and debt-servicing obligations that could compress net margins during cyclical downturns.
- ODM Disintermediation and Customer Concentration: Dell's heavy reliance on a concentrated group of large AI infrastructure buyers leaves its order backlog vulnerable, while major enterprise customers increasingly evaluate direct Original Design Manufacturer sourcing models to bypass traditional OEMs.
- Valuation Scrutiny and Profit-Taking Volatility: Following a massive multi-week rally driven by AI narrative momentum, elevated valuation multiples relative to historical averages leave the equity exposed to institutional profit-taking, analyst cautiousness, and heightened intraday downside volatility.
Recommended Articles


