


Bloom Energy Corp Stock (BE) Moved Down by 6.17% on Sep 24: Facts Behind the Movement
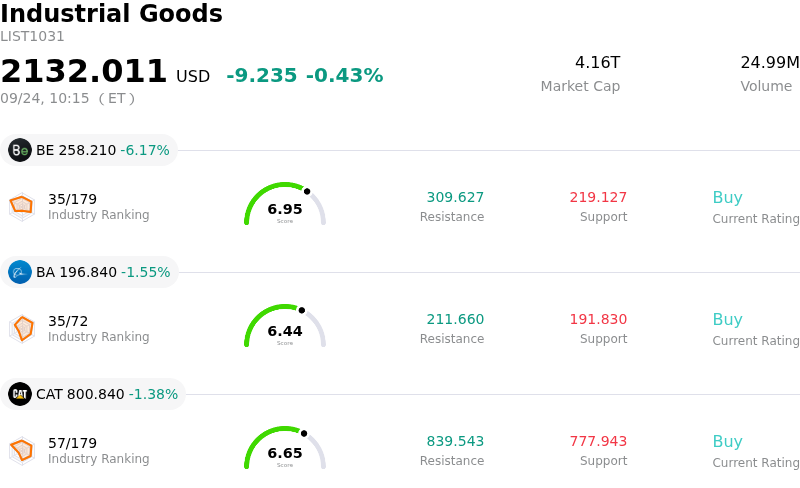
Bloom Energy Corp (BE) moved down by 6.17%. The Industrial Goods sector is down by 0.43%. The company underperformed the industry. Top 3 stocks by turnover in the sector: Bloom Energy Corp (BE) down 6.17%; Boeing Co (BA) down 1.64%; Caterpillar Inc (CAT) down 1.40%.
What is driving Bloom Energy Corp (BE)’s stock price down today?
Bloom Energy experienced notable selling pressure following reports that Oracle Corporation invoked a force majeure clause on Project Jupiter, a massive artificial intelligence data center development in New Mexico. The proposed campus was slated to rely heavily on Bloom Energy’s solid oxide fuel cell technology to provide behind-the-meter, off-grid power generation. The force majeure notice was reportedly issued to the project developer, a unit of Blue Owl Capital, amid mounting timeline risks caused by local regulatory permit denials for a vital natural gas pipeline required to feed the fuel cell infrastructure. Because the pipeline completion date has been pushed back, concerns have intensified regarding potential project delays and delayed revenue recognition for Bloom's power server deployments.
The news highlights a critical operational vulnerability in the rapidly growing artificial intelligence infrastructure sector: fuel delivery and pipeline permitting bottlenecks. Bloom Energy’s recent growth thesis has been heavily anchored by hyperscaler demand and fast-turnaround deployments for power-dense data centers. Obstacles in securing fuel supply lines or environmental permits for large-scale facilities threaten to slow down the conversion of project backlogs into recognized earnings. Investor anxiety over these deployment hurdles prompted an immediate re-evaluation of near-term revenue timelines tied to major enterprise cloud partners.
The sharp pullback also reflects market repricing following an extraordinary run-up in the stock, which was recently propelled by its official inclusion in the S&P 500 index. Given the stock's elevated valuation multiples built on aggressive AI growth expectations, any disruption to key commercial projects leaves little margin for execution error. Additional overhangs, including recent executive share sales executed under pre-arranged trading plans and ongoing legal scrutiny around supply chain disclosures ahead of an upcoming lead-plaintiff deadline, further amplified selling pressure. Coupled with broader macro pressure on high-multiple clean energy and tech equities, these combined factors triggered significant intraday downward momentum.
Technical Analysis of Bloom Energy Corp (BE)
Technically, Bloom Energy Corp (BE) shows a MACD (12,26,9) value of 0.831, indicating a buy signal. The RSI at 53.174 suggests neutral condition and the Williams %R at 54.900 suggests neutral condition. Please monitor closely.
Media Coverage of Bloom Energy Corp (BE)
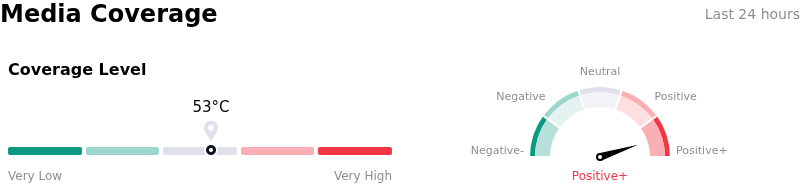
In terms of media coverage, Bloom Energy Corp (BE) shows a coverage score of 53, indicating a moderate level of media attention. The overall market sentiment index is currently in extremely bullish zone.
Fundamental Analysis of Bloom Energy Corp (BE)
Bloom Energy Corp (BE) is in the Industrial Goods industry. Its latest annual revenue is $2.02B, ranking 78 in the industry. The net profit is $-88.43M, ranking 210 in the industry. Company Profile
Over the past month, multiple analysts have rated the company as Buy, with an average price target of $269.85, a high of $354.00, and a low of $98.94.
More details about Bloom Energy Corp (BE)
Company Specific Risks:
- Project Jupiter Force Majeure Notice: Oracle Corporation invoked a force majeure clause on the $165 billion Project Jupiter AI data center campus in New Mexico, which was planned to be powered by Bloom Energy fuel cells; a six-month delay on a critical Energy Transfer LP natural gas pipeline following state permit denials directly threatens Bloom's scheduled fuel cell deployments and associated revenue recognition.
- Counterparty and Project Financing Risk: Bloom's heavy growth exposure to mega-scale AI data center deals is under pressure as $18 billion in loans linked to the Oracle-leased facility traded down to 89–91 cents on the dollar, reflecting severe institutional financing friction and execution risk for Bloom's key off-grid power deployment partner.
- Pending Securities Litigation and Supply Chain Scrutiny: The company faces active legal exposure from a federal securities class action lawsuit alleging misleading disclosures regarding its reliance on Chinese-sourced scandium oxide for fuel cell manufacturing, with market focus intensified by an approaching September 28, 2026 lead-plaintiff deadline.
- Valuation Multiples and High Capital Intensity: Trading at an extended valuation following a massive multi-quarter run-up, institutional analysts highlight risk surrounding Bloom's capital-intensive business model, which requires substantial cash outlays and potential equity or debt financing to support manufacturing expansion.
Recommended Articles


