


Newmont Corporation Stock (NEM) Opened Down by 4.18% on Sep 23: Drivers Behind the Movement
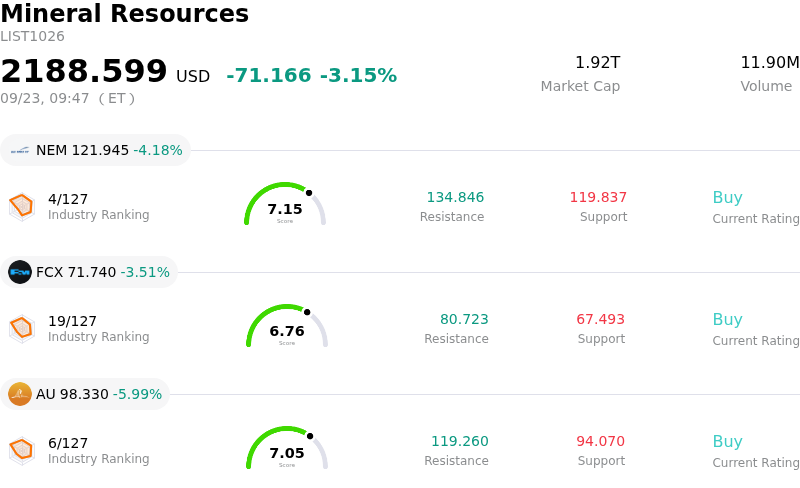
Newmont Corporation (NEM) opened down by 4.18%. The Mineral Resources sector is down by 3.15%. The company underperformed the industry. Top 3 stocks by turnover in the sector: Newmont Corporation (NEM) down 4.18%; Freeport-McMoRan Inc (FCX) down 3.33%; Anglogold Ashanti PLC (AU) down 5.83%.
What is driving Newmont Corporation (NEM)’s stock price down today?
The primary driver behind the downward movement and intraday volatility in Newmont Corporation shares is the pullback in underlying gold spot prices. The precious metals market faced persistent pressure as the U.S. dollar hovered near recent highs and Treasury yields remained elevated following hawkish signals from Federal Reserve officials. With monetary policy expectations pointing toward prolonged higher interest rates to manage persistent inflationary pressures, non-yielding assets like gold experienced reduced appeal. Given Newmont's significant operational leverage as the world's largest gold producer, sudden drops in bullion prices directly weigh on realized profit margins and near-term cash flow expectations, sparking sector-wide selling pressure.
In addition to commodity headwinds, broader sector dynamics and profit-taking contributed to the stock's retreat. Following a period of strong performance driven by robust second-quarter free cash flow and aggressive share repurchases, investors executed tactical profit-taking amidst shifting market sentiment. A broader market rotation toward growth and technology assets drew capital away from basic materials and defensive equities. Technically, as the stock fell below key short-term moving averages during trading, momentum traders and automated trading strategies accelerated sell orders, amplifying intraday price swings.
Despite short-term volatility stemming from macro and commodity fluctuations, Newmont's long-term fundamental profile remains supported by its operational scale and capital discipline. The company's recent record free cash flow generation, strong liquidity position, ongoing share buybacks, and upcoming dividend payments provide structural support. However, investors remain sensitive to broader industry challenges, including sticky all-in sustaining costs and capital expenditure requirements for core projects. In the near term, share price performance will likely continue to track macro indicators, Federal Reserve rate expectations, and directional swings in spot gold prices.
Technical Analysis of Newmont Corporation (NEM)
Technically, Newmont Corporation (NEM) shows a MACD (12,26,9) value of -2.499, indicating a neutral signal. The RSI at 48.884 suggests neutral condition and the Williams %R at 83.940 suggests oversold condition. Please monitor closely.
Fundamental Analysis of Newmont Corporation (NEM)
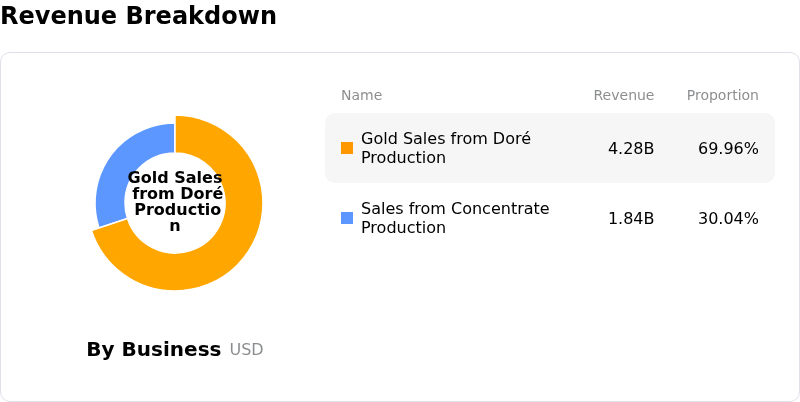
Newmont Corporation (NEM) is in the Mineral Resources industry. Its latest annual revenue is $22.67B, ranking 10 in the industry. The net profit is $7.08B, ranking 3 in the industry. Company Profile
Over the past month, multiple analysts have rated the company as Buy, with an average price target of $139.53, a high of $205.00, and a low of $79.00.
More details about Newmont Corporation (NEM)
Company Specific Risks:
- Commodity Price Retracement and Hawkish Rate Headwinds: Spot gold prices retreating below $4,350 per ounce due to hawkish Federal Reserve interest rate commentary have directly triggered intraday downside pressure on Newmont stock, highlighting the company's direct earnings vulnerability to falling bullion prices.
- Escalating All-In Sustaining Costs (AISC): Projected 2026 AISC rising to $1,680 per ounce—up significantly from $1,358 per ounce in 2025—driven by elevated energy and diesel costs, deferred capital expenditure requirements, and increased royalty taxes in key operating regions such as Ghana, threatening operating margin compression.
- Production Output Declines and Site Transition Drag: Attributable gold production dropped 13% year-over-year with full-year output guidance slowing to 5.26 million ounces, hampered by lower ore grades, non-core asset divestments, and operational transition challenges across major sites including Cadia and Peñasquito.
- Valuation Premium and Analyst Downgrade Risks: Trading at a Forward PEG ratio of 1.73 and a premium relative to gold mining peers, recent analyst target price cuts and rating downgrades to Hold leave the stock highly vulnerable to profit-taking and multiple contraction as upside momentum cools.
Recommended Articles


