

BNB (BNBUSD) Volatility Intensified on Sep 16: What You Should Know

Source Tradingkey

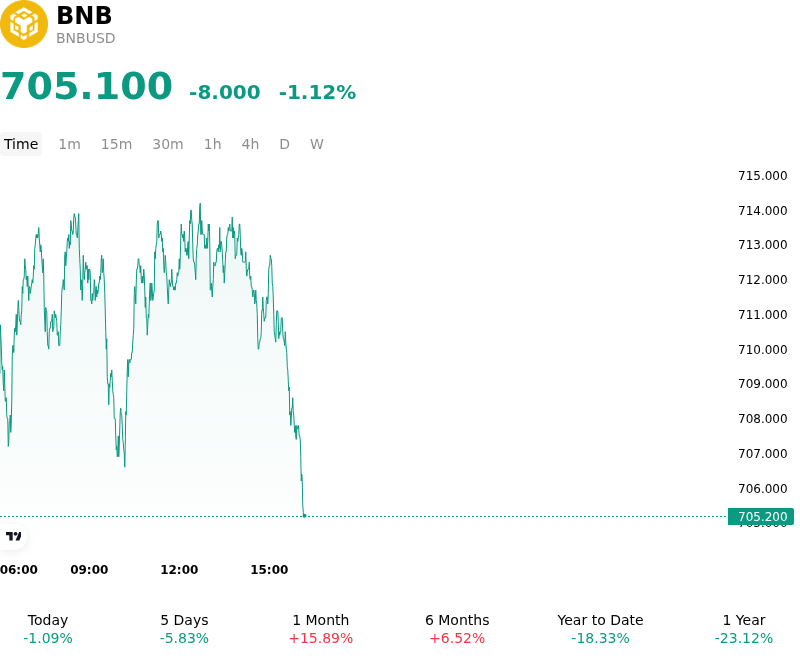
BNB (BNBUSD) is down 1.12% at Sep 16 04:10(ET), now at $705.1, with a 7-day down of 3.66%.
SummaryOverview

What is driving BNB (BNBUSD)’s stock price down today?

The modest decline in BNB came as broader digital asset markets faced downside pressure driven by regulatory headwinds in the U.S. and cautious macroeconomic positioning. Investor sentiment across major cryptocurrencies shifted negative following the U.S. Senate procedural vote that failed to advance comprehensive digital asset market structure legislation. This legislative setback created renewed policy uncertainty for institutional market participants, triggering systemic profit-taking and leverage reduction across liquid altcoins, which dampened overall risk appetite.

Compounding the regulatory friction, market participants engaged in widespread de-risking ahead of the Federal Reserve monetary policy announcement. Heightened interest rate uncertainty and tighter global liquidity expectations weighed heavily on high-beta digital assets, encouraging crypto derivatives traders to reduce open interest and unwind leveraged long positions. This liquidity contraction and elevated derivative liquidation activity contributed to short-term order book slippage, pressuring BNB prices lower alongside the broader crypto market.

Despite the intraday retreat, the move primarily reflects an event-driven macro and regulatory repricing rather than structural weakness within the underlying network. BNB Chain continues to show expanding operational activity, supported by solid TVL metrics in real-world asset tokenization and recent network performance enhancements aimed at increasing transaction throughput. Medium-term institutional catalysts, including pending spot ETF filings and token supply burn mechanics, remain key structural anchors as institutional investors monitor Federal Reserve policy signals and Washington legislative developments for market stabilization.

Technical Analysis of BNB (BNBUSD)

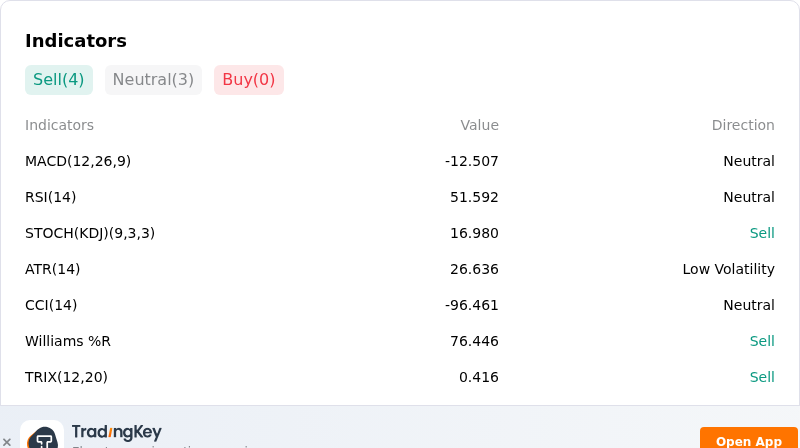
Technically, BNB (BNBUSD) shows a MACD (12,26,9) value of -12.507, indicating a neutral signal. The RSI at 51.592 suggests neutral condition and the Williams %R at 76.446 suggests sell condition. Please monitor closely.
IndicatorAnalysis

More details about BNB (BNBUSD)

Recent Events and Risks:

  • U.S. Regulatory Setbacks and Operational Overhang: The failure of the procedural vote on the U.S. CLARITY Act triggered a broad digital asset market sell-off, impacting BNB alongside other top-cap altcoins. Coupled with ongoing compliance scrutiny around Binance under European MiCA regulations, persistent regulatory uncertainty continues to constrain institutional capital allocation.
  • Technical Resistance Rejection and Leverage Unwinding: BNB faced strong overhead supply rejection after failing to sustain momentum above the $750–$770 resistance zone. The technical pullback drove short-term profit-taking and triggered an unwinding of leveraged perpetual long positions, forcing the price down toward critical support near $710–$718.
  • DeFi Leverage Looping and Cascading Liquidation Risk: Concentrated leverage accumulation on BNB Chain lending protocols—where large whale addresses deposit BNB as collateral to borrow stablecoins—creates structural vulnerability, with further intraday breakdown threatening to trigger automated liquidation cascades.
  • Macro Liquidity Strain and Treasury Yield Spikes: Rising U.S. 10-year Treasury yields and lingering inflation concerns ahead of central bank policy decisions have triggered broader risk-off sentiment. This macro tightening has thinned order book depth, leaving BNBUSD susceptible to amplified downside volatility during institutional portfolio rebalancing.
Disclaimer: For information purposes only. Past performance is not indicative of future results.
placeholder
US August CPI lands tonight: after a 5.4% PPI shock, will the Fed hike on September 16?US August PPI came in at 5.4% year-on-year, above the 5.3% consensus, with core PPI at 4.6%. Traders have pushed the odds of a 25bp Fed hike on September 15-16 to around 70%. Tonight's CPI is the last major inflation print before the decision — here is the full calendar, the consensus numbers, and what a hot versus cool reading would mean for the dollar, yields, gold and stocks.
Author  Irene Q.
Sep 11, Fri
US August PPI came in at 5.4% year-on-year, above the 5.3% consensus, with core PPI at 4.6%. Traders have pushed the odds of a 25bp Fed hike on September 15-16 to around 70%. Tonight's CPI is the last major inflation print before the decision — here is the full calendar, the consensus numbers, and what a hot versus cool reading would mean for the dollar, yields, gold and stocks.
placeholder
Brent tests $108 as a key export pipeline stays shut — can the rally clear $110?Brent crude rose 2.55% to $106.97 and WTI 2.32% to $102.30 as a major regional export pipeline remained offline with no restart timeline. Front-month backwardation has widened to $5.53 from $3.84 a week ago, European gas is at its highest since December 2022, and one analyst sees $119.48 if talks stall.
Author  Irene Q.
Sep 14, Mon
Brent crude rose 2.55% to $106.97 and WTI 2.32% to $102.30 as a major regional export pipeline remained offline with no restart timeline. Front-month backwardation has widened to $5.53 from $3.84 a week ago, European gas is at its highest since December 2022, and one analyst sees $119.48 if talks stall.
placeholder
Fed hike odds near 90% into Wednesday's decision — how to trade the dollar, gold and the S&P 500A 0.3% monthly core CPI print has lifted the market-implied probability of a 25bp Fed hike on 16 September to roughly 86.5% ~ 90%, which would be the first increase since July 2023. Here is the decision timeline, the pricing versus the forecasts, both scenarios, and the key levels for the dollar, gold and the S&P 500.
Author  Suzie
Sep 14, Mon
A 0.3% monthly core CPI print has lifted the market-implied probability of a 25bp Fed hike on 16 September to roughly 86.5% ~ 90%, which would be the first increase since July 2023. Here is the decision timeline, the pricing versus the forecasts, both scenarios, and the key levels for the dollar, gold and the S&P 500.
placeholder
Gold falls below $4,300 as higher US yields bolster Fed rate hike betsGold price (XAU/USD) tumbles to near $4,295 during the early Asian session on Tuesday. The precious metal faces some selling pressure as rising bond yields and surging energy prices strengthen expectations that the US Federal Reserve (Fed) will raise interest rates this week. 
Author  FXStreet
Yesterday 01: 23
Gold price (XAU/USD) tumbles to near $4,295 during the early Asian session on Tuesday. The precious metal faces some selling pressure as rising bond yields and surging energy prices strengthen expectations that the US Federal Reserve (Fed) will raise interest rates this week. 
placeholder
【Daily Brief】10-year Treasury yield briefly tops 5%, S&P 500 slips to 7,602 and the dollar firms at 99.3 as the Fed's decision eve beginsThe 10-year Treasury yield touched 5.014% on Monday — its first print above 5% since October 2023 — while the S&P 500 closed 0.48% lower at 7,619.98 and the dollar index firmed to 99.3. Here is the full market wrap ahead of Wednesday's FOMC decision, the dot plot and the August retail sales report, plus today's CLARITY Act Senate vote.
Author  Irene Q.
Yesterday 08: 16
The 10-year Treasury yield touched 5.014% on Monday — its first print above 5% since October 2023 — while the S&P 500 closed 0.48% lower at 7,619.98 and the dollar index firmed to 99.3. Here is the full market wrap ahead of Wednesday's FOMC decision, the dot plot and the August retail sales report, plus today's CLARITY Act Senate vote.
goTop
quote