


Shopify Inc Stock (SHOP) Moved Up by 3.42% on Sep 14: What Signal Does It Send?
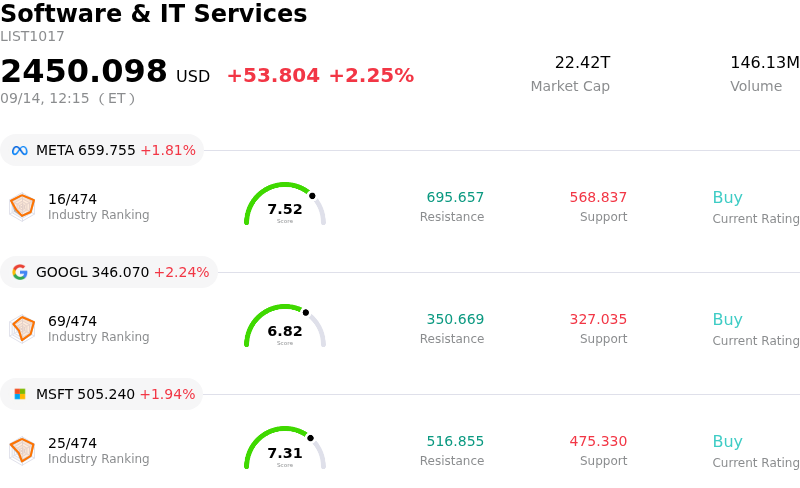
Shopify Inc (SHOP) moved up by 3.42%. The Software & IT Services sector is up by 2.25%. The company outperformed the industry. Top 3 stocks by turnover in the sector: Meta Platforms Inc (META) up 1.81%; Alphabet Inc Class A (GOOGL) up 2.10%; Microsoft Corp (MSFT) up 1.93%.
What is driving Shopify Inc (SHOP)’s stock price up today?
Shopify experienced positive trading momentum driven primarily by fresh Wall Street endorsement and renewed investor optimism around its leadership in digital commerce innovation. Analysts at Sanford C. Bernstein initiated coverage on the company with a bullish rating and an elevated price target, asserting that Shopify is uniquely positioned to capture the entire merchant lifecycle from customer acquisition to fulfillment. The research note emphasized that artificial intelligence is lowering barriers to entry for new entrepreneurs, expanding the broader market for e-commerce infrastructure. Positive commentary and target adjustments from other research firms also helped revitalize sentiment after recent sector-wide profit-taking.
Fundamental drivers continue to reinforce institutional interest. The company's operational performance highlights accelerating gross merchandise volume and expanding merchant solutions adoption. Strong top-line revenue gains paired with strict cost discipline—evidenced by flat headcount across multiple consecutive quarters—have substantially improved free cash flow margins and operating leverage. Furthermore, expanding adoption of AI-driven merchant tools and payment services continues to enhance user retention and monetizable ecosystem value.
Notwithstanding the upward trajectory, significant intraday volatility underscored persistent market friction over valuation. Trading at an elevated valuation multiple relative to the software sector, the stock remains sensitive to broader market sentiment, yield shifts, and competitive dynamics among tech platforms. Intraday price swings reflected active back-and-forth between momentum buyers capitalizing on the analyst upgrade and short-term traders harvesting gains amidst macroeconomic uncertainty. However, bullish sentiment ultimately prevailed as investors focused on the company's expanding market footprint and long-term earnings growth potential.
Technical Analysis of Shopify Inc (SHOP)
Technically, Shopify Inc (SHOP) shows a MACD (12,26,9) value of -5.959, indicating a neutral signal. The RSI at 44.294 suggests neutral condition and the Williams %R at 71.457 suggests sell condition. Please monitor closely.
Fundamental Analysis of Shopify Inc (SHOP)
Shopify Inc (SHOP) is in the Software & IT Services industry. Its latest annual revenue is $11.56B, ranking 32 in the industry. The net profit is $1.23B, ranking 40 in the industry. Company Profile
Over the past month, multiple analysts have rated the company as Buy, with an average price target of $171.12, a high of $220.00, and a low of $110.00.
More details about Shopify Inc (SHOP)
Company Specific Risks:
- Elevated Valuation Premium and Volatility Sensitivity: Trading at an aggressive valuation multiple exceeding 80x forward earnings, Shopify remains hyper-sensitive to multiple compression and tactical options hedging, leaving the share price vulnerable to sharp intraday selloffs.
- Competitive Disruption from AI Commerce Agents: Wall Street research highlights growing structural risk from tech competitors, particularly Meta's deployment of standalone AI business agents, which could enable merchants to manage storefronts, ads, and customer interactions outside of Shopify's ecosystem.
- Insider Share Sales and Form 144 Filings: Corporate filings with the SEC disclose prearranged share liquidations by senior executives, including planned stock sales by CEO Tobias Lütke under Rule 10b5-1 trading plans, dampening near-term institutional sentiment.
- Margin Compression from Mix Shift and Tech Expenditures: Operating margins face ongoing headwinds due to a revenue shift toward lower-margin merchant solutions like Shopify Payments, alongside rising expenses related to artificial intelligence infrastructure and large language model development.
Recommended Articles


