


JasmyCoin Price Forecast: Upbit delisting raises risk of further losses
- JasmyCoin struggles to regain momentum as resistance at $0.0040 caps upside.
- Korea’s Upbit cryptocurrency exchange delists JASMY alongside other tokens, citing unresolved issues, deficiencies and user risk.
- JASMY remains under pressure amid extended weakness in momentum indicators and a persistent resistance cluster.
JasmyCoin (JASMY) shows signs of stability at the time of writing on Monday. However, the token remains constrained between support at $0.0035 and resistance at $0.0040. Since May, its technical structure has continued to deteriorate, with the price falling from highs of $0.0078. JASMY’s outlook suggests that bears have the upper hand as bulls fight to defend key support levels.
Upbit exchange delists JASMY, STORJ and TT
Upbit, one of South Korea’s leading cryptocurrency exchanges, announced the delisting of several tokens, including JASMY, Storj (STORJ), and ThurderCore (TT), on Monday. Exchange users will no longer be able to buy or sell the tokens as support ends for STORJ/KRW, STORJ/BTC, JASMY/BTC, JASMY/USDT, TT/KRW, and TT/BTC trading pairs. All open orders will be canceled.
“Following this announcement, we will not be supporting services such as airdrops, wallet upgrades, and hard forks for digital assets scheduled to have their trading support terminated,” Upbit stated.
Upbit said the decision to end support for the tokens followed numerous shortcomings and that users could be harmed. These shortcomings included disclosures, business fundamentals, sustainability, and demonstrable progress for JASMY and STORJ.
TT, meanwhile, faced concerns over total issuance, circulation plans, business plan revisions, and a lack of transparency and procedural integrity. Users can withdraw affected assets until October 14.
Technical analysis: JASMY sellers retain control
JASMY trades at $0.0039, extending a bearish near-term bias as price holds beneath all major exponential moving averages (EMAs), suggesting the token remains in a capped recovery phase after failing to sustain the prior break toward the trendline resistance zone whose key break price lies near $0.0049.
Momentum readings reinforce this cautious tone, with the Relative Strength Index (RSI) hovering around 40 and the Moving Average Convergence Divergence (MACD) indicator slipping marginally negative, hinting that sellers still retain the upper hand while rallies are being sold into.
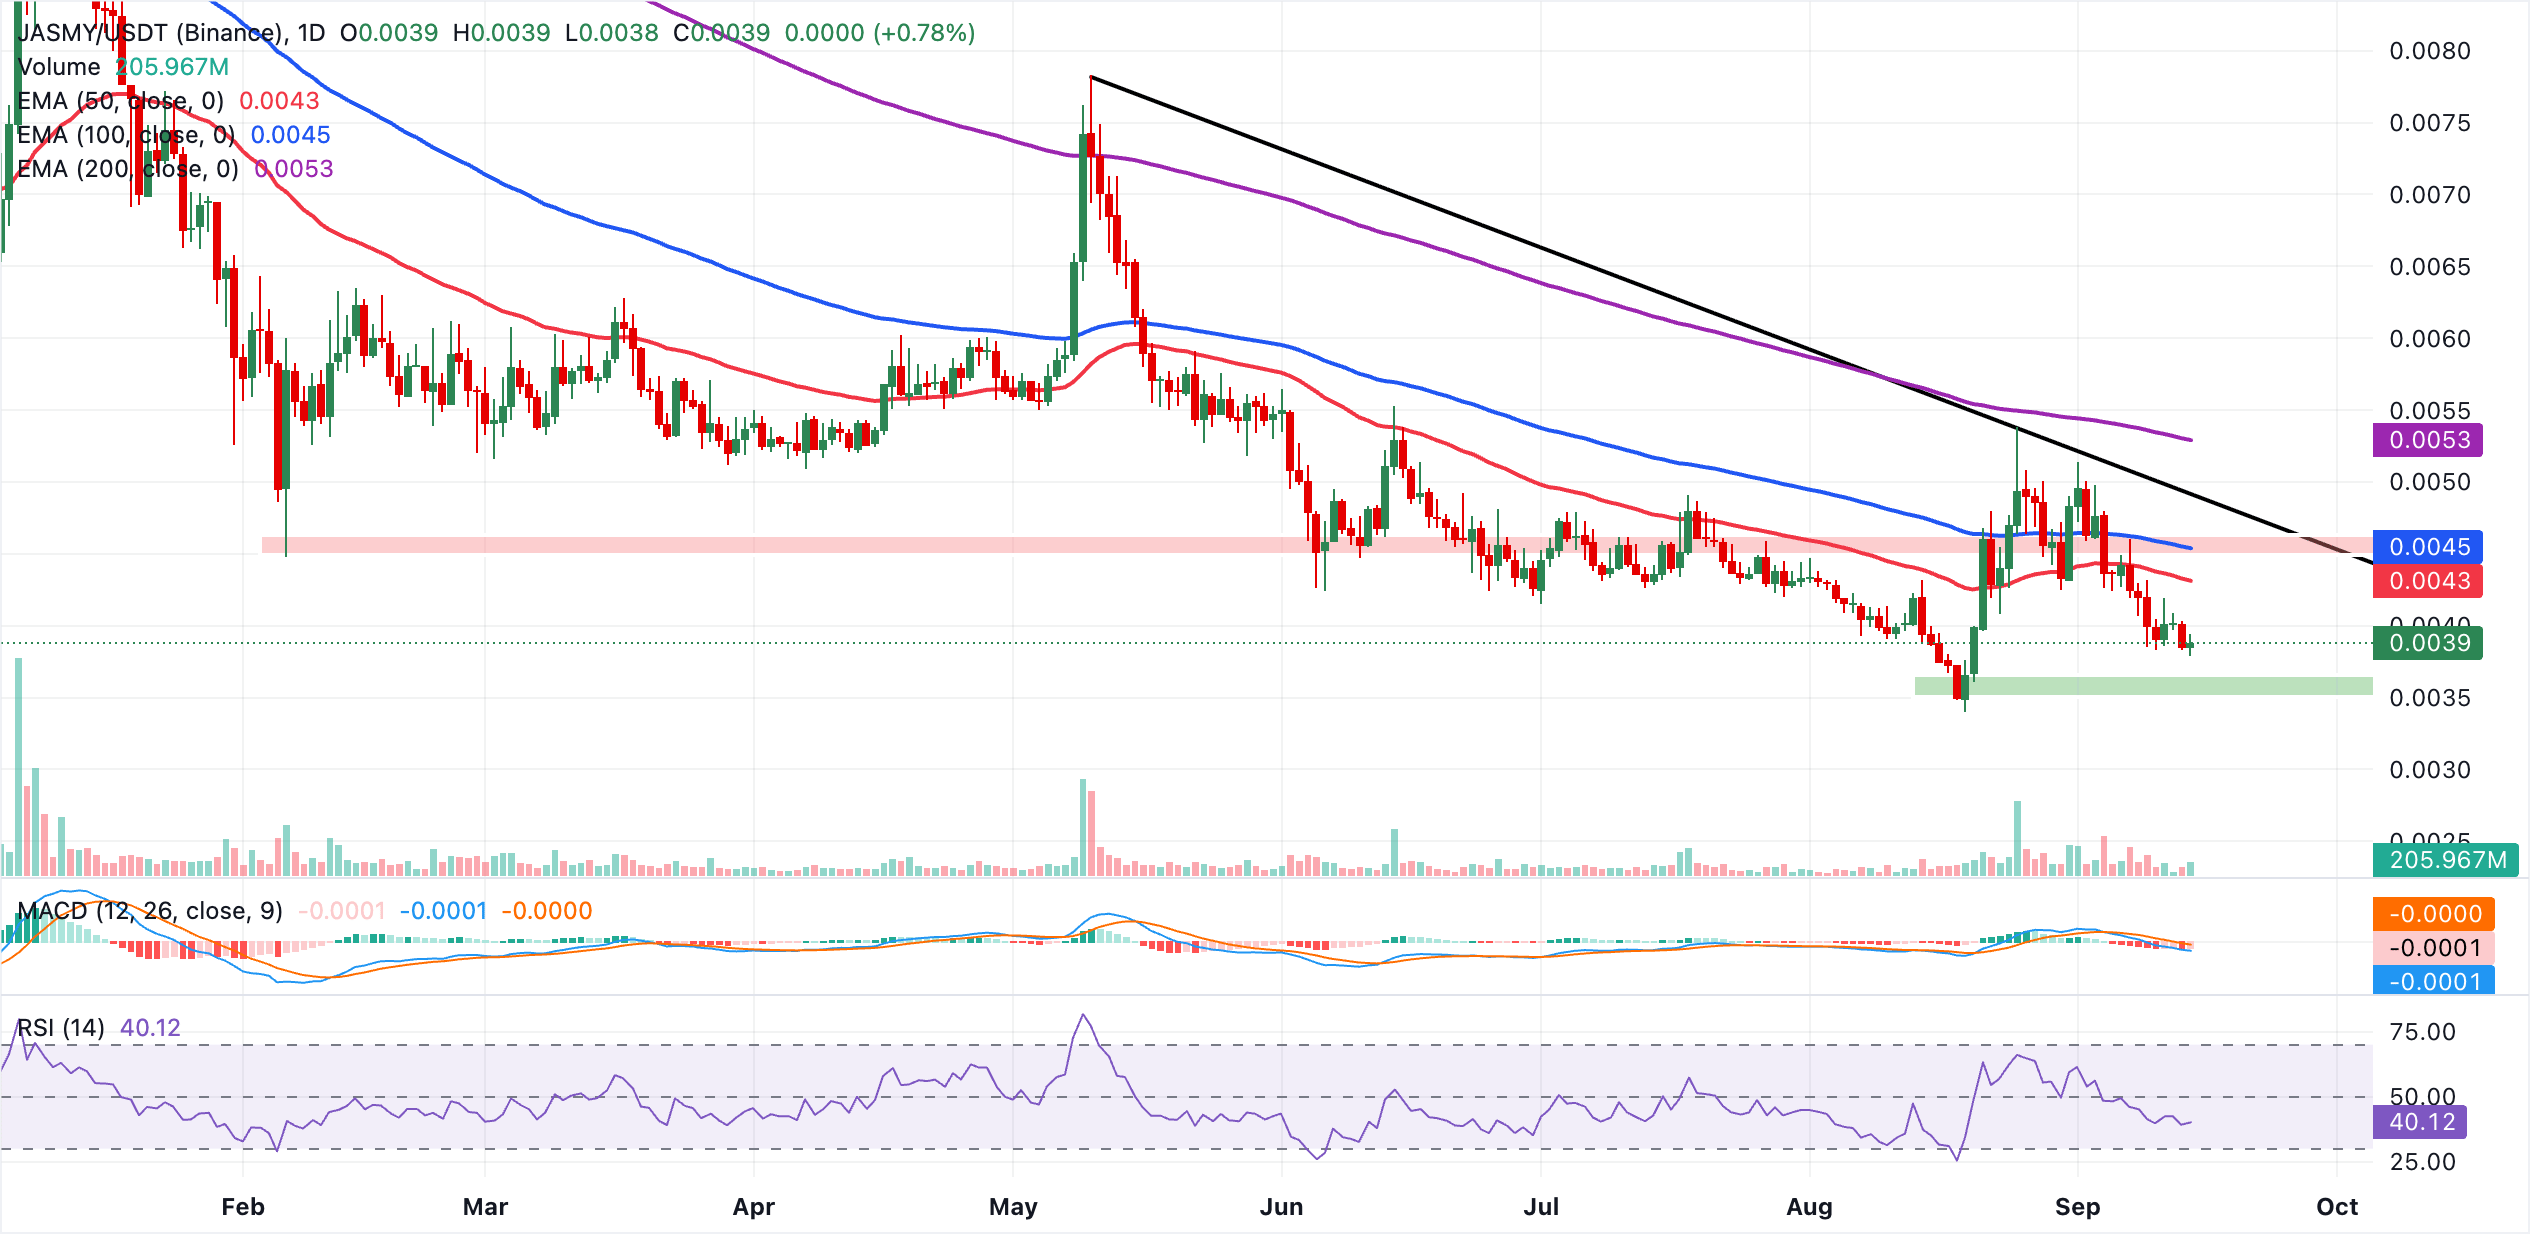
Immediate resistance lies at the 50-day EMA around $0.0043, followed by the 100-day EMA clustered near $0.0045, which together define the first barrier that bulls would need to reclaim to ease downside pressure. Above these, the former resistance trendline break at $0.0049 and the 200-day EMA at approximately $0.0053 form a higher supply zone that would likely cap any stronger bounce for now. With no clear structural support identified below the current price on the daily chart, the pair appears vulnerable to further slippage, and only a daily close back above the 50-day and 100-day EMAs would hint at a more constructive base-building phase.
(The technical analysis of this story was written with the help of an AI tool. Know more.)
Cryptocurrency prices FAQs
Token launches influence demand and adoption among market participants. Listings on crypto exchanges deepen the liquidity for an asset and add new participants to an asset’s network. This is typically bullish for a digital asset.
A hack is an event in which an attacker captures a large volume of the asset from a DeFi bridge or hot wallet of an exchange or any other crypto platform via exploits, bugs or other methods. The exploiter then transfers these tokens out of the exchange platforms to ultimately sell or swap the assets for other cryptocurrencies or stablecoins. Such events often involve an en masse panic triggering a sell-off in the affected assets.
Macroeconomic events like the US Federal Reserve’s decision on interest rates influence crypto assets mainly through the direct impact they have on the US Dollar. An increase in interest rate typically negatively influences Bitcoin and altcoin prices, and vice versa. If the US Dollar index declines, risk assets and associated leverage for trading gets cheaper, in turn driving crypto prices higher.
Halvings are typically considered bullish events as they slash the block reward in half for miners, constricting the supply of the asset. At consistent demand if the supply reduces, the asset’s price climbs.
Recommended Articles


