

Oracle Stock Price Forecast: Reported New Round of Layoffs, Ellison Cancels Share Sale Plan, Will the Stock Stabilize at $142?

Source Tradingkey

TradingKey — On September 14 ET, Oracle (ORCL) shares dropped further to near $141, hitting a nearly two-week low.

Oracle has reportedly initiated a new round of layoffs, with the reduction rate in some teams potentially reaching double digits. The layoffs had been brewing internally, with the primary objective of lowering payroll costs to support the company's expanding investments in AI infrastructure. Prior to this round of job cuts, the company's workforce stood at approximately 141,000.

Among them, posts have begun appearing on social media platforms such as Reddit from users claiming to be affected by the latest round of layoffs. Last Friday, Oracle disclosed that it expanded its ongoing corporate restructuring plan, adding $700 million for employee severance and job cuts to address financial pressures resulting from heavy investments in AI infrastructure.

Notably, just days earlier, Oracle founder Larry Ellison canceled a plan to sell up to $7.5 billion worth of company stock only a day after publicly disclosing it. Oracle has yet to explain the cancellation of the stock sale plan, while Ellison still holds over 40% of the company's shares. According to The Wall Street Journal, the trading plan, known as a '10b5-1 plan,' was adopted on June 22 and was originally scheduled to expire on October 24.
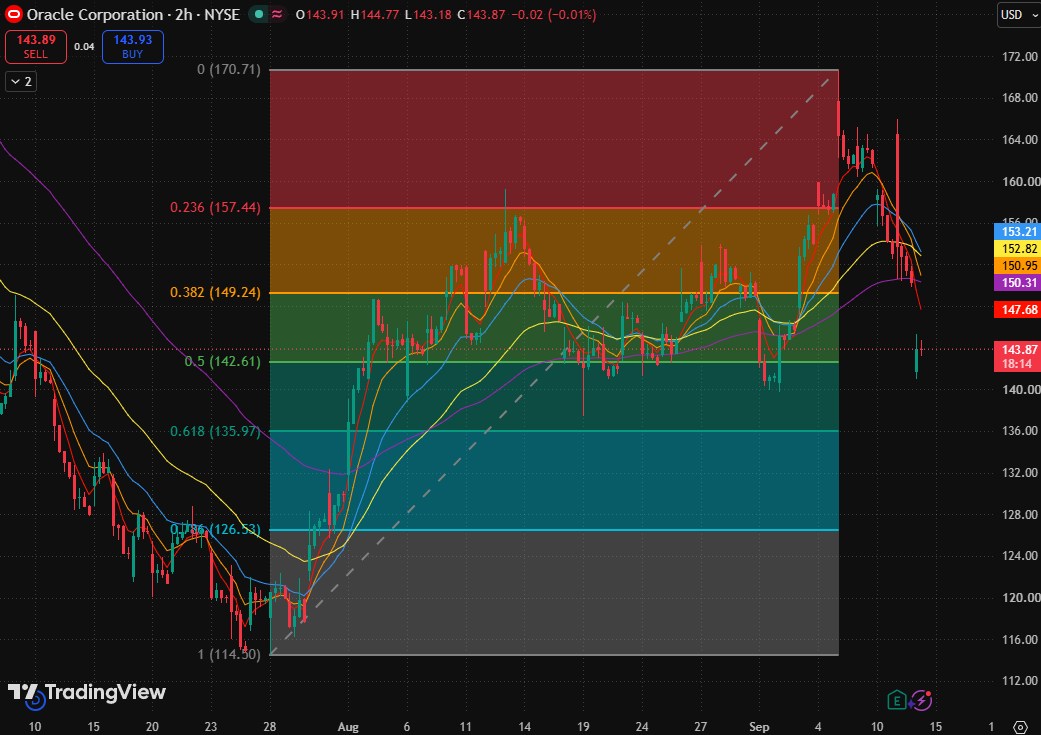
image-90735f2e36954aee91b1bc9d65785635

Oracle 2-hour stock price chart. Source: TradingView

Oracle surged to near $170 in early September, but pulled back after releasing its earnings report. The stock price has now fallen below its short-, medium-, and long-term moving averages, sitting just slightly above the 0.5 Fibonacci pullback level ($142.61). This indicates that the previous upward structure has cooled significantly, and the stock is currently undergoing a key support test following a sharp decline, rather than being in a rebound phase following a confirmed bottom.

Currently, the most critical defensive level is the 0.5 Fibonacci pullback level ($142.61). If subsequent 2-hour candlestick charts can stabilize above this level and successively reclaim the 5-day moving average ($147.72) and the 0.382 Fibonacci pullback level ($149.24), a technical recovery may begin to take shape.

Until the price reclaims the $149.24–$150.97 area, any bounce is more likely to be a weak counter-trend rally. Meanwhile, the $147.72–$153.23 range overlaps with the 5-day, 10-day, 20-day, 80-day, and 160-day moving averages, as well as the $149.24 pullback level, creating a heavy resistance zone against rebounds. If a bounce fails to reclaim this region, the current trend should still be viewed as weak consolidation following a drop.

If $142.61 fails to hold, the rally structure from $114.50 will be further damaged, potentially opening up downside space toward the 0.618 Fibonacci pullback level ($135.97).

Disclaimer: For information purposes only. Past performance is not indicative of future results.
placeholder
Silver Price Forecast: XAG/USD falls to near $63.50 amid Fed hike bets, higher oil pricesSilver price (XAG/USD) loses its gains from the previous day, trading around $63.50 per troy ounce during Asian hours on Monday. Non-yielding Silver is currently facing significant headwinds driven by rising Federal Reserve (Fed) rate-hike expectations for the upcoming September decision.
Author  FXStreet
7 hours ago
Silver price (XAG/USD) loses its gains from the previous day, trading around $63.50 per troy ounce during Asian hours on Monday. Non-yielding Silver is currently facing significant headwinds driven by rising Federal Reserve (Fed) rate-hike expectations for the upcoming September decision.
placeholder
Fed hike odds near 90% into Wednesday's decision — how to trade the dollar, gold and the S&P 500A 0.3% monthly core CPI print has lifted the market-implied probability of a 25bp Fed hike on 16 September to roughly 86.5% ~ 90%, which would be the first increase since July 2023. Here is the decision timeline, the pricing versus the forecasts, both scenarios, and the key levels for the dollar, gold and the S&P 500.
Author  Suzie
10 hours ago
A 0.3% monthly core CPI print has lifted the market-implied probability of a 25bp Fed hike on 16 September to roughly 86.5% ~ 90%, which would be the first increase since July 2023. Here is the decision timeline, the pricing versus the forecasts, both scenarios, and the key levels for the dollar, gold and the S&P 500.
placeholder
Brent tests $108 as a key export pipeline stays shut — can the rally clear $110?Brent crude rose 2.55% to $106.97 and WTI 2.32% to $102.30 as a major regional export pipeline remained offline with no restart timeline. Front-month backwardation has widened to $5.53 from $3.84 a week ago, European gas is at its highest since December 2022, and one analyst sees $119.48 if talks stall.
Author  Irene Q.
11 hours ago
Brent crude rose 2.55% to $106.97 and WTI 2.32% to $102.30 as a major regional export pipeline remained offline with no restart timeline. Front-month backwardation has widened to $5.53 from $3.84 a week ago, European gas is at its highest since December 2022, and one analyst sees $119.48 if talks stall.
placeholder
TradingKey Daily Market Briefing: CPI Data Boosts Rate Hike Expectations, Geopolitical Risks Spark Oil Price SurgeTracking Market TrendsTradingKey - The three major U.S. stock indices rose across the board last Friday, with the Dow Jones Industrial Average rising 0.98%, the Nasdaq Composite Index gaining 0.96%, a
Author  TradingKey
16 hours ago
Tracking Market TrendsTradingKey - The three major U.S. stock indices rose across the board last Friday, with the Dow Jones Industrial Average rising 0.98%, the Nasdaq Composite Index gaining 0.96%, a
placeholder
Gold Price Forecast: PPI and Oil Prices Fuel Inflation Concerns, Can CPI Change Gold's Direction?As of the Asian session on September 11, gold prices (XAUUSD) remained in weak consolidation today after dropping sharply to near $4,300 on Thursday, with the latest price trading around
Author  TradingKey
Sep 11, Fri
As of the Asian session on September 11, gold prices (XAUUSD) remained in weak consolidation today after dropping sharply to near $4,300 on Thursday, with the latest price trading around
goTop
quote