


Arista Networks Inc Stock (ANET) Moved Down by 5.12% on Sep 14: What Signal Does It Send?
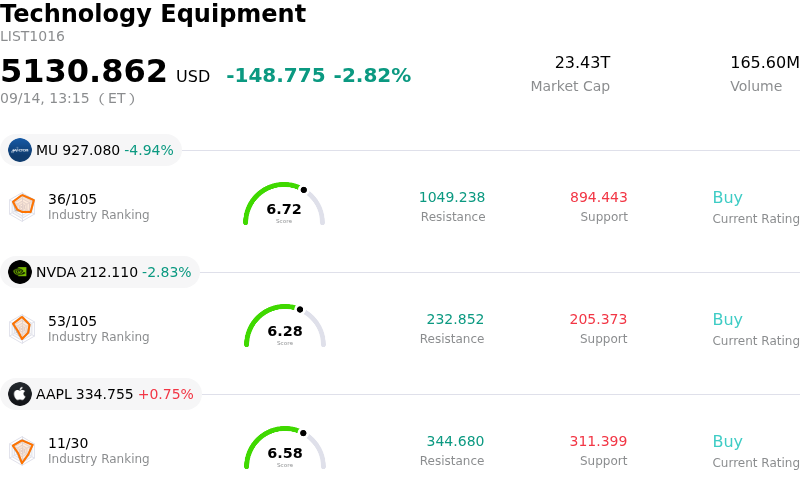
Arista Networks Inc (ANET) moved down by 5.12%. The Technology Equipment sector is down by 2.82%. The company underperformed the industry. Top 3 stocks by turnover in the sector: Micron Technology Inc (MU) down 4.94%; NVIDIA Corp (NVDA) down 2.85%; Apple Inc (AAPL) up 0.75%.
What is driving Arista Networks Inc (ANET)’s stock price down today?
Arista Networks experienced a pullback as broader tech-sector profit-taking and valuation recalibration triggered increased volatility across networking and artificial intelligence infrastructure stocks. After a multi-month rally driven by accelerated AI data center deployments and upward revisions to full-year revenue targets, the stock reached elevated valuation multiples relative to historical averages and the broader networking peer group. When overall market volatility rises, high-multiple technology leaders often face amplified profit-taking as institutional investors rebalance positions and lock in recent gains.
While management recently raised its annual top-line outlook following improved component visibility, operational nuances continue to temper momentum. Management has emphasized that component constraints and memory price increases remain near-term pressures that impact gross margins before contractual price adjustments take full effect. Additionally, management reiterated that next-generation scale-up Ethernet architectures for AI clusters remain in pilot phases, with broad revenue realization not expected until 2028, creating a gap between long-term expectations and near-term catalysts.
The stock also reflects sensitivity around customer concentration among major cloud hyperscalers and substantial multi-year purchase commitments secured to navigate supply constraints. While fundamental demand for high-bandwidth switches, campus networking, and cloud EOS software remains robust, intraday volatility underlines market sensitivity to delivery execution, component lead times, and broader tech sector valuation resets. Investors are focusing on quarterly shipping performance to verify that backlogs seamlessly translate into profitable revenue expansion.
Technical Analysis of Arista Networks Inc (ANET)
Technically, Arista Networks Inc (ANET) shows a MACD (12,26,9) value of -1.595, indicating a neutral signal. The RSI at 48.932 suggests neutral condition and the Williams %R at 67.257 suggests sell condition. Please monitor closely.
Media Coverage of Arista Networks Inc (ANET)
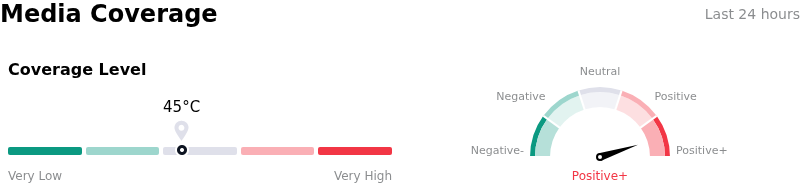
In terms of media coverage, Arista Networks Inc (ANET) shows a coverage score of 45, indicating a moderate level of media attention. The overall market sentiment index is currently in extremely bullish zone.
Fundamental Analysis of Arista Networks Inc (ANET)
Arista Networks Inc (ANET) is in the Technology Equipment industry. Its latest annual revenue is $9.01B, ranking 5 in the industry. The net profit is $3.51B, ranking 2 in the industry. Company Profile
Over the past month, multiple analysts have rated the company as Buy, with an average price target of $237.35, a high of $289.00, and a low of $140.00.
More details about Arista Networks Inc (ANET)
Company Specific Risks:
- Valuation Premium and Volatility Sensitivity: Trading at a trailing price-to-earnings ratio near 63x—substantially above its five-year historical median of 41.6x—the stock faces heightened intraday volatility and profit-taking during interest rate shifts, leaving little valuation margin of safety.
- Supply Commitment Costs and Margin Compression Lag: Arista expanded multi-year supply purchase commitments to $9.7 billion to secure critical memory and networking chips; however, rising component costs impact gross margins immediately, whereas customer price adjustments suffer a multi-quarter lag due to fulfilling existing backlog orders.
- Substantial Executive Insider Disclosures: Recent SEC Form 4 filings show over $720 million in cumulative insider share liquidations over recent months—including major divestments by executive leadership—without any corresponding insider open-market purchases.
- AI Revenue Realization Lag and Hyperscaler Concentration: Wall Street analysts point to an 18-month delay before massive AI fabric supply commitments translate into reported revenues, exposing near-term financial results to capital expenditure pacing adjustments from core cloud hyperscaler clients.
Recommended Articles


