


KLA Corp Stock (KLAC) Moved Down by 6.06% on Sep 14: Key Drivers Unveiled
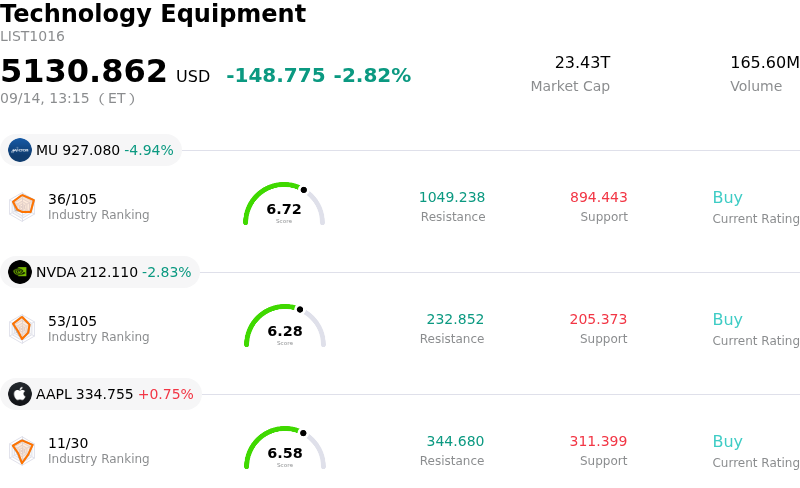
KLA Corp (KLAC) moved down by 6.06%. The Technology Equipment sector is down by 2.82%. The company underperformed the industry. Top 3 stocks by turnover in the sector: Micron Technology Inc (MU) down 4.94%; NVIDIA Corp (NVDA) down 2.85%; Apple Inc (AAPL) up 0.75%.
What is driving KLA Corp (KLAC)’s stock price down today?
KLA Corporation experienced significant downward pressure as part of a broad selloff across the semiconductor and wafer fabrication equipment sectors. The primary catalyst was a sudden shift in market sentiment regarding the trajectory of artificial intelligence capital expenditures. Statements from prominent artificial intelligence executives advocating for a deliberate deceleration in frontier model development sparked widespread concern among investors that major technology companies and chipmakers might reassess or delay their aggressive infrastructure investment plans. Because KLA provides critical process control, inspection, and metrology systems essential for advanced semiconductor manufacturing, its growth trajectory is closely tied to aggressive capacity expansion in leading-edge logic, foundry, and memory architectures.
Semiconductor capital equipment suppliers are inherently sensitive to shifts in long-term spending expectations, often experiencing heightened volatility when market participants re-evaluate order book sustainability. Prior to the downturn, KLA had benefited from strong momentum driven by accelerating investments in advanced packaging and artificial intelligence infrastructure. However, this multi-month rally elevated valuation multiples well above historical benchmarks and intrinsic value estimates, leaving the equity vulnerable to macro-level shocks and profit-taking. As technical indicators weakened, institutional derating compounded intraday selling pressure across the broader semiconductor equipment space.
Despite the pullback, KLA maintains a formidable fundamental position characterized by high gross margins, strong free cash flow generation, and structural leadership in process control. The long-term thesis remains supported by rising process control intensity as chip architectures become increasingly complex. Nonetheless, short-term stock performance will likely be dictated by broader semiconductor sentiment and upcoming clarity on whether discussions surrounding artificial intelligence safety will lead to tangible adjustments in capital spending by key foundry and logic customers.
Technical Analysis of KLA Corp (KLAC)
Technically, KLA Corp (KLAC) shows a MACD (12,26,9) value of 0.931, indicating a neutral signal. The RSI at 38.196 suggests neutral condition and the Williams %R at 89.127 suggests oversold condition. Please monitor closely.
Media Coverage of KLA Corp (KLAC)
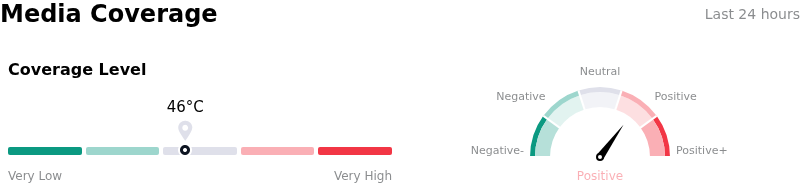
In terms of media coverage, KLA Corp (KLAC) shows a coverage score of 46, indicating a moderate level of media attention. The overall market sentiment index is currently in bullish zone.
Fundamental Analysis of KLA Corp (KLAC)
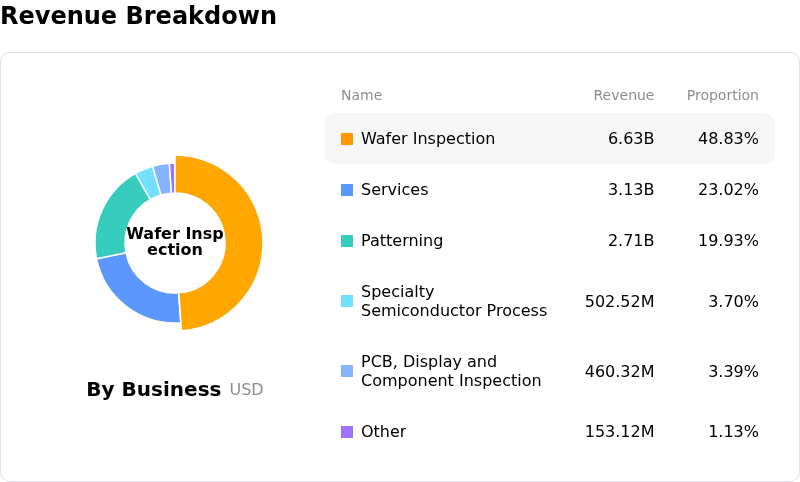
KLA Corp (KLAC) is in the Technology Equipment industry. Its latest annual revenue is $13.58B, ranking 15 in the industry. The net profit is $4.83B, ranking 11 in the industry. Company Profile
Over the past month, multiple analysts have rated the company as Buy, with an average price target of $229.27, a high of $325.00, and a low of $138.80.
More details about KLA Corp (KLAC)
Company Specific Risks:
- Macro AI Infrastructure Spend Uncertainty: Recent intraday selling pressure stems from shifting market expectations around AI capital expenditure buildouts, directly threatening demand for KLA's process control and metrology systems among advanced foundry and memory chipmakers.
- Severe Valuation Overhang: Updated valuation models flag a -53.9% margin of safety, with discounted cash flow intrinsic value estimated at $117.38 versus current market trading around $180.64, leaving the stock highly exposed to multiple compression during broader tech sell-offs.
- Geopolitical and Export Restriction Exposure: Heightened institutional analyst focus on KLA's 25% to 35% revenue reliance on mainland China highlights significant vulnerability to escalating U.S. technology export controls and trade restrictions targeting advanced wafer fab equipment.
- High Customer Concentration and Capex Cyclicality: KLA's earnings performance remains tightly tied to the capital expenditure budgets of a small group of leading semiconductor manufacturers, making top-line conversion sensitive to capacity expansion deferrals or fab timing delays.
Recommended Articles


