


XRP (XRPUSD) Is down 1.01% on Aug 16: What Do On-Chain Data and Market Sentiment Show?
XRP (XRPUSD) is down 1.01% at Aug 16 20:25(ET), now at $0.9891, with a 7-day down of 2.98%.
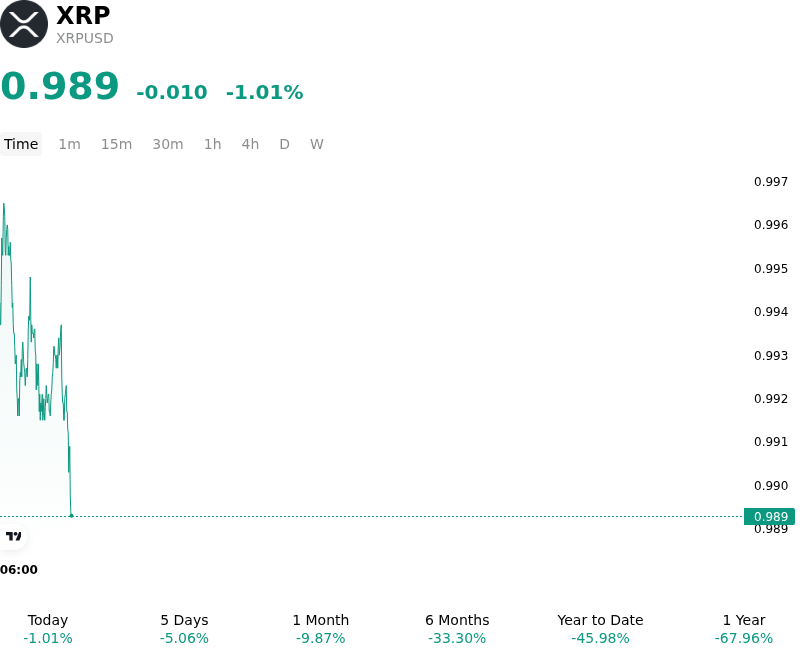
What is driving XRP (XRPUSD)’s stock price down today?
The soft trading performance in XRP reflected broader caution across risk assets and digital asset markets, driven primarily by restrictive global monetary policy expectations and subdued broad-market liquidity. With the Federal Reserve maintaining an elevated policy rate environment, global risk appetite remained muted. Market participants exercised prudence ahead of upcoming central bank macroeconomic signals, limiting liquidity expansion and keeping institutional capital largely parked in cash equivalents or traditional yield-bearing instruments rather than rotating into higher-beta digital assets.
Institutional demand drivers specific to XRP also experienced temporary headwinds. Recent momentum in spot digital asset investment products showed signs of deceleration, with weekly capital inflows into spot XRP vehicles moderating relative to previous periods. Furthermore, policy momentum surrounding key regulatory frameworks encountered delays, as major legislative initiatives aimed at clarifying digital asset classifications faced extended legislative debate. The temporary absence of immediate regulatory catalysts reduced institutional urgency to accumulate positions, leaving the asset lacking fresh structural buying pressure.
From a technical and market structure perspective, price action was constrained by key psychological support levels. As spot prices hovered near major chart thresholds, market liquidity thinned, leaving order books sensitive to routine sell flows and modest profit-taking. Derivatives positioning reflected similar conservatism, characterized by declining open interest and muted leverage deployment during weekend trading sessions. Selective capital rotation across the broader crypto space favored high-dominance assets like Bitcoin over major altcoins, while public commentary from prominent market strategists favoring higher-cap digital assets added minor sentiment friction.
Ultimately, the intraday pullback represents a temporary, liquidity-driven repricing rather than a fundamental breakdown in long-term ecosystem adoption. While expanding cross-border payment rails and institutional enterprise integrations continue to anchor the broader narrative, immediate price direction remains tied to macroeconomic liquidity, central bank policy expectations, and the trajectory of spot ETF capital flows. Investors will continue to monitor Federal Reserve policy communications, legislative progress on digital asset regulation, and institutional fund flow metrics to assess market trajectory.
Technical Analysis of XRP (XRPUSD)
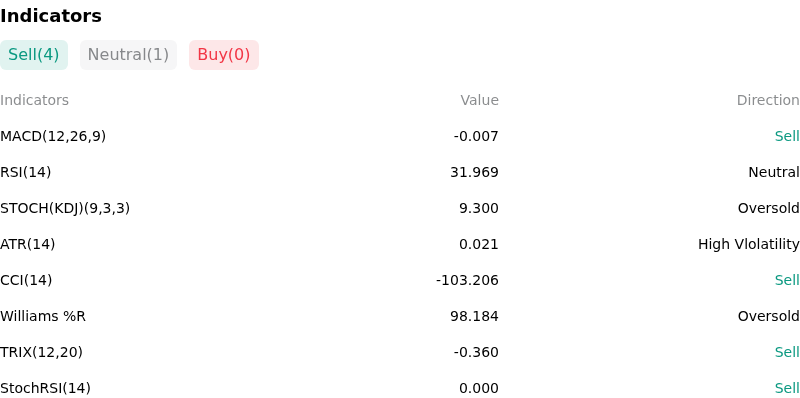
Technically, XRP (XRPUSD) shows a MACD (12,26,9) value of -0.007, indicating a sell signal. The RSI at 31.969 suggests neutral condition and the Williams %R at 98.184 suggests oversold condition. Please monitor closely.
More details about XRP (XRPUSD)
Recent Events and Risks:
- Stagnating Spot ETF Inflows: Institutional demand for spot XRP exchange-traded funds has slowed significantly, with daily net inflows flattening to zero across recent trading sessions and eroding total net assets under management, leaving the market without consistent institutional buy-side support during sell-offs.
- Cross-Chain Relayer Security Exploit: Market sentiment remains fragile following a vulnerability in XRPL relayer logic on the Coreum-XRPL bridge, which resulted in unauthorized asset minting, unbacked bridged XRP reserves, and an emergency suspension of bridge operations.
- Derivatives Leverage and Long Squeeze Cascades: A low Taker Buy/Sell ratio alongside elevated open interest in perpetual futures indicates heavily stacked leverage, leaving XRP vulnerable to cascading long liquidations when price breaks below key psychological support thresholds.
- Contraction in On-Chain Network Activity: XRP Ledger utility metrics have deteriorated, highlighted by a sharp decline of over 40% in daily transactions, signaling reduced network engagement and weaker organic demand for the native asset.
Recommended Articles


