


BNB (BNBUSD) Is down 1.05% on Aug 14: Why It Happened
BNB (BNBUSD) is down 1.05% at Aug 14 07:15(ET), now at $602, with a 7-day up of 1.88%.
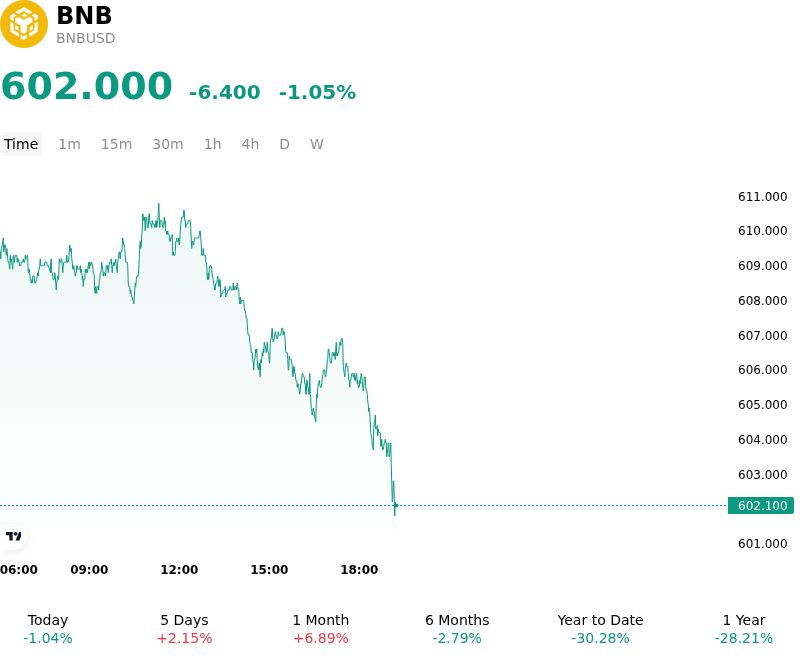
What is driving BNB (BNBUSD)’s stock price down today?
The pullback in BNB was primarily driven by a broader soft tone across the cryptocurrency ecosystem, as a retreat in flagship assets triggered a wave of leveraged long liquidations across major derivatives exchanges. With open interest unwinding, forced sell orders concentrated on leveraged bullish positions, exerting immediate downward pressure on major Layer-1 tokens. The decline reflected short-term liquidity repricing rather than a structural breakdown, as traders adjusted risk exposure amid temporary cautiousness in broader global markets.
Ecosystem-specific dynamics also fostered localized profit-taking. Despite structural tailwinds—including Grayscale increasing its portfolio allocation to BNB within its multi-asset smart contract vehicle and steady expansion in tokenized equity activity on the BNB Chain—traders capitalized on recent consolidation near key technical resistance to lock in profits. Additionally, recent industry security reports detailing legacy smart contract vulnerabilities across public chains contributed to minor headwinds in overall sentiment, encouraging short-term speculative capital to step aside.
From an institutional perspective, the movement represents an event-driven flush of derivatives leverage within an ongoing consolidation phase. BNB Chain retains robust underlying metrics, supported by dominant utility in ecosystem fees, high network transaction throughput, and expanding institutional integration. However, intraday price action remains constrained by spot market flows and broader crypto market risk sentiment. Investors will continue monitoring derivative liquidation levels, monetary policy expectations, and broader capital allocation trends across top-tier digital assets.
Technical Analysis of BNB (BNBUSD)
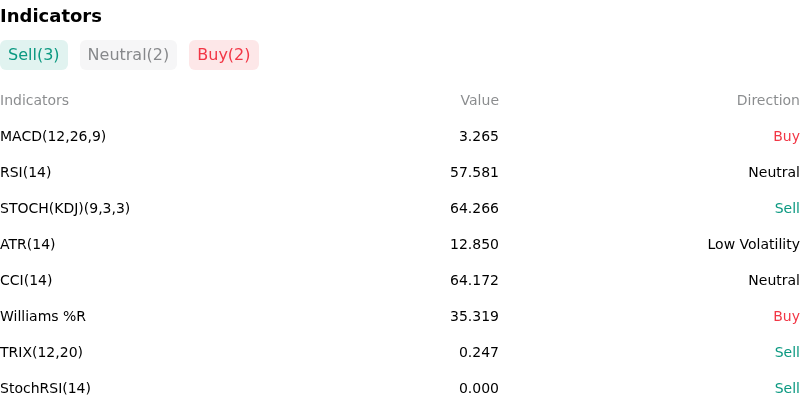
Technically, BNB (BNBUSD) shows a MACD (12,26,9) value of 3.265, indicating a buy signal. The RSI at 57.581 suggests neutral condition and the Williams %R at 35.319 suggests buy condition. Please monitor closely.
More details about BNB (BNBUSD)
Recent Events and Risks:
- Futures Leverage and Liquidation Cascade Exposure: Open interest in BNB futures contracts remains elevated above $1 billion while derivative markets experience mounting long liquidations across major assets, leaving BNB vulnerable to sharp long-squeeze cascades if support near $594–$600 breaks.
- 200-Day Moving Average Overhead Resistance: BNB's recent price attempt toward two-month highs met immediate sell-side rejection at the 200-day moving average around $618–$620, where flat spot trading volumes indicate insufficient buying pressure to absorb overhead supply.
- Counterparty Transaction Cutoffs and Regulatory Compliance: Binance's enforcement of new compliance measures prohibiting transaction processing with a list of third-party platforms and asset service providers increases operational friction and capital flow restrictions across the core ecosystem supporting BNB.
- Spot Market Volume Contraction and Delisting Volatility: A global 21.7% month-over-month drop in centralized exchange spot volumes, coupled with Binance adding several tokens to its risk-monitoring list for potential delisting, reflects broader liquidity weakness across exchange-dependent trading desks.
Recommended Articles


