


Ethereum (ETHUSD) Is up 1.17% on Aug 12: Here Is Why
Ethereum (ETHUSD) is up 1.17% at Aug 12 05:30(ET), now at $1901.64, with a 7-day down of 0.68%.
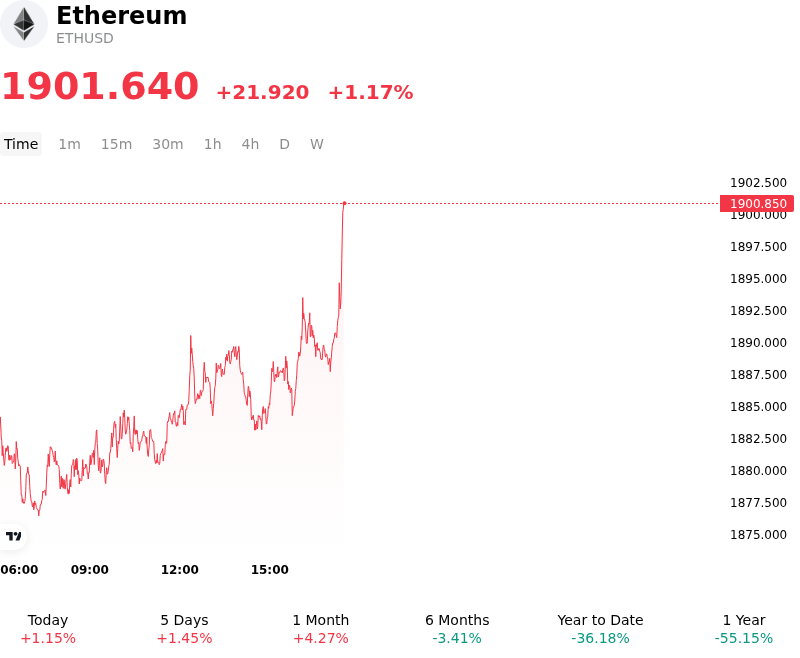
What is driving Ethereum (ETHUSD)’s stock price up today?
Ethereum experienced upward momentum as broader market sentiment stabilized following heightened macroeconomic focus around U.S. Consumer Price Index inflation data. Market participants repriced monetary policy expectations, anticipating a cooling inflation trajectory that could ease interest rate pressures and provide breathing room for risk assets. This macro shift prompted a moderate easing in benchmark U.S. Treasury yields and a temporary pull-back in the U.S. dollar index, creating a supportive liquidity backdrop for digital assets. Ethereum benefited directly from this liquidity relief as broader market risk appetite improved.
Institutional spot demand and corporate treasury participation provided substantial underlying support for the price recovery. On-chain data indicated a notable surge in institutional spot purchasing activity leading into the session, complementing steady accumulation by corporate entities expanding their reserve holdings. This spot absorption helped defend key technical support levels near the lower bound of the recent consolidation channel. Simultaneously, the ongoing migration of Ether into native staking contracts and a persistent drop in exchange token supply tightened available market liquidity, allowing incremental buying volume to exert upward price pressure.
Derivatives positioning and market structure dynamics further contributed to the intraday advance. Prior to the macro release, options and futures traders had established defensive hedges and net-short exposure. As spot prices rebounded from oversold technical levels and reclaimed short-term moving averages, short covering and delta-hedging by market makers created additional buy-side momentum. While Ethereum remains subject to ongoing volatility tied to Federal Reserve interest rate expectations and spot ETF flow cycles, strong network staking fundamentals and corporate treasury adoption continue to underpin long-term structural demand.
Technical Analysis of Ethereum (ETHUSD)
Technically, Ethereum (ETHUSD) shows a MACD (12,26,9) value of -9.303, indicating a neutral signal. The RSI at 53.699 suggests neutral condition and the Williams %R at 32.711 suggests buy condition. Please monitor closely.
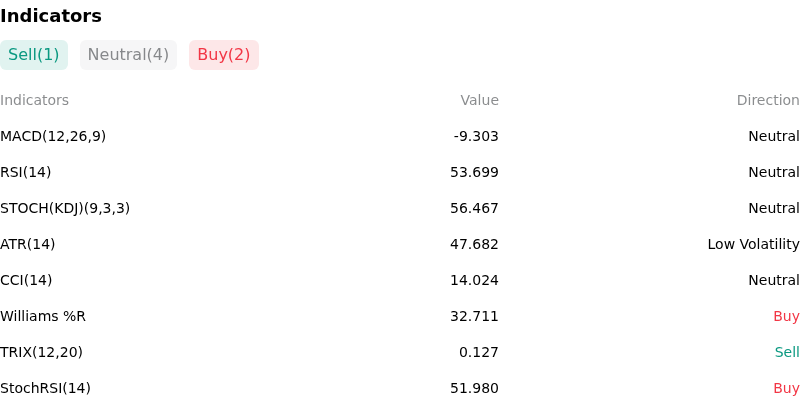
More details about Ethereum (ETHUSD)
Recent Events and Risks:
- Spot Ethereum ETF Flow Reversal: Institutional spot Ethereum ETFs recorded consecutive net daily outflows, including $14.6 million in net redemptions that snapped a multi-day buying streak, signaling a retreat in institutional capital and weakening structural spot demand.
- Derivatives Long Liquidations and Resistance Rejections: Price rejections at the $1,900–$1,948 resistance zone triggered localized long liquidations down toward $1,870, leaving concentrated downside liquidation clusters near $1,850 that risk triggering forced selling cascades if support gives way.
- Weakening Momentum and Cooling Funding Rates: Ethereum funding rates dropped over 30% alongside a stagnant Relative Strength Index (RSI), reflecting a sharp contraction in bullish speculative leverage and stalled buying power across major derivatives exchanges.
- Macro De-risking Ahead of Economic Data: Digital asset markets experienced broad risk-off de-risking and a surge in exchange net deposits ahead of key U.S. inflation data, leading leveraged traders to trim exposure amid firming Treasury yields and broader market caution.
Recommended Articles


