


Ethereum (ETHUSD) Is down 1.23% on Aug 6: Here Is Why
Ethereum (ETHUSD) is down 1.23% at Aug 6 09:10(ET), now at $1891.15, with a 7-day down of 1.46%.
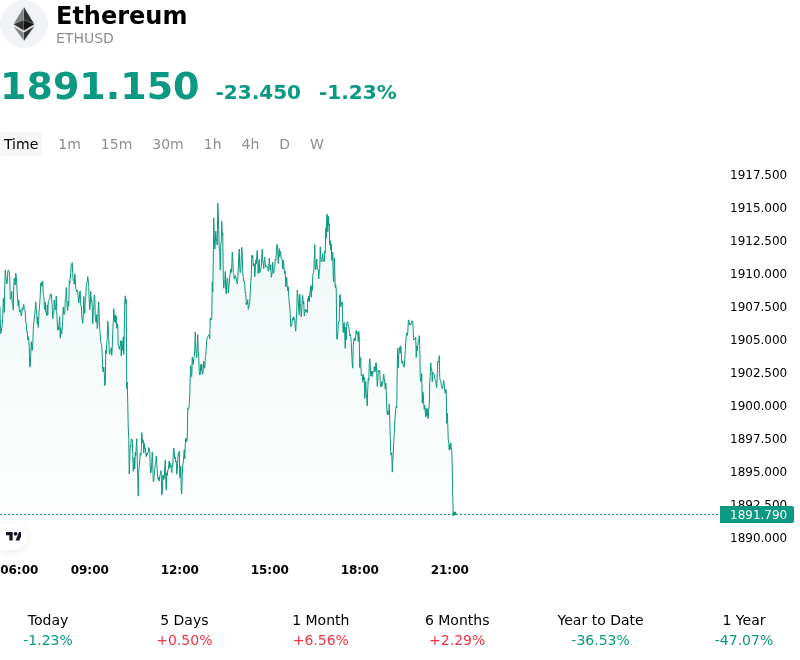
What is driving Ethereum (ETHUSD)’s stock price down today?
The recent downward pressure on Ethereum reflects a tightening of global liquidity conditions and a recalibration of risk-weighted returns. Institutional investors appear to be responding to a marginal uptick in U.S. Treasury yields, which has narrowed the spread between risk-free rates and Ethereum’s staking yield. This narrowing premium reduces the incentive for capital to remain in digital assets when sovereign debt offers competitive, low-risk returns, prompting a rotation into more defensive allocations.
Institutional sentiment has been further tempered by net outflows from spot Ethereum ETFs. These vehicles, which now serve as a primary barometer for professional demand, experienced a period of distribution as asset managers adjusted portfolios ahead of upcoming macroeconomic data releases. This selling pressure in the spot market often triggers a reflexive response in the derivatives space, where a modest increase in long liquidations has exacerbated intraday volatility. The lack of aggressive dip-buying from institutional desks suggests a cautious wait-and-see approach regarding the broader trajectory of monetary policy.
On-chain dynamics are also contributing to the current sentiment shift. While Layer-2 scaling solutions continue to see robust adoption, the resulting migration of transaction activity away from the Ethereum mainnet has led to a sustained reduction in base-layer fee burn. This shift has temporarily neutralized the deflationary narrative that previously supported the asset's valuation. When network-driven supply contractions slow down, the market becomes more sensitive to external macro shocks and liquidity drains.
Furthermore, the broader digital asset market is contending with a period of consolidation following recent ecosystem upgrades. Investors are currently assessing the long-term impact of protocol efficiency on token value accrual. In the absence of a fresh fundamental catalyst or a dovish pivot from central banks, Ethereum remains highly sensitive to shifts in the U.S. dollar index and fluctuations in aggregate risk appetite. The current price action is representative of a structural repricing rather than a localized event, as capital flows prioritize liquidity preservation over speculative expansion.
Technical Analysis of Ethereum (ETHUSD)
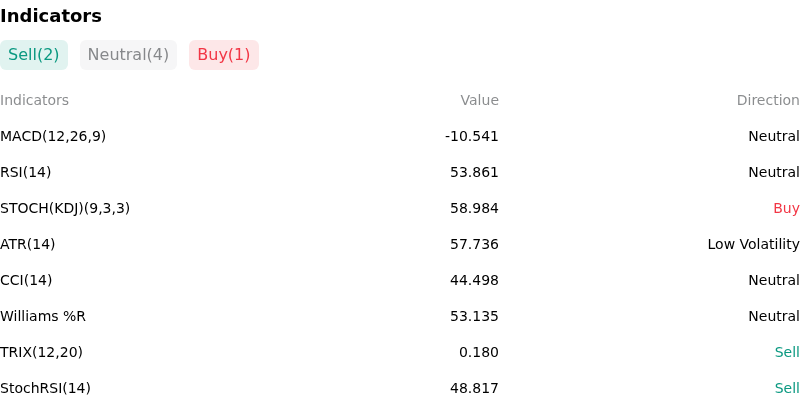
Technically, Ethereum (ETHUSD) shows a MACD (12,26,9) value of -10.541, indicating a neutral signal. The RSI at 53.861 suggests neutral condition and the Williams %R at 53.135 suggests neutral condition. Please monitor closely.
More details about Ethereum (ETHUSD)
Recent Events and Risks:
- Persistent Spot ETF Outflows: Recent institutional data confirms a trend of net negative flows across US-based Spot Ethereum ETFs, largely driven by sustained redemptions from the Grayscale Ethereum Trust (ETHE), which continues to create a supply-demand imbalance and overhead price resistance.
- Relative Value Erosion (ETH/BTC Breakdown): The ETH/BTC exchange rate has recently plummeted to multi-year lows, signaling a significant loss of institutional confidence in Ethereum relative to Bitcoin and increasing the risk of "capitulation" selling as traders exit lagging ETH positions to chase momentum elsewhere.
- Foundation and Whale Distribution: On-chain tracking has identified several high-value transfers of ETH from Ethereum Foundation-linked wallets and large "whale" entities to centralized exchanges over the last 48 hours, raising fears of an impending spot market dump and triggering preemptive selling by retail participants.
- Layer-2 Cannibalization and Fee Compression: Heightened concerns regarding Ethereum's "burn" rate have emerged as network activity increasingly migrates to Layer-2 scaling solutions, resulting in lower base-layer congestion and a transition back to an inflationary supply model, which undermines the core deflationary investment thesis.
Recommended Articles


