


Bitcoin (BTCUSD) Is down 2.49% on Jul 28: Why It Happened
Bitcoin (BTCUSD) is down 2.49% at Jul 28 00:15(ET), now at $63315.67, with a 7-day down of 4.61%.
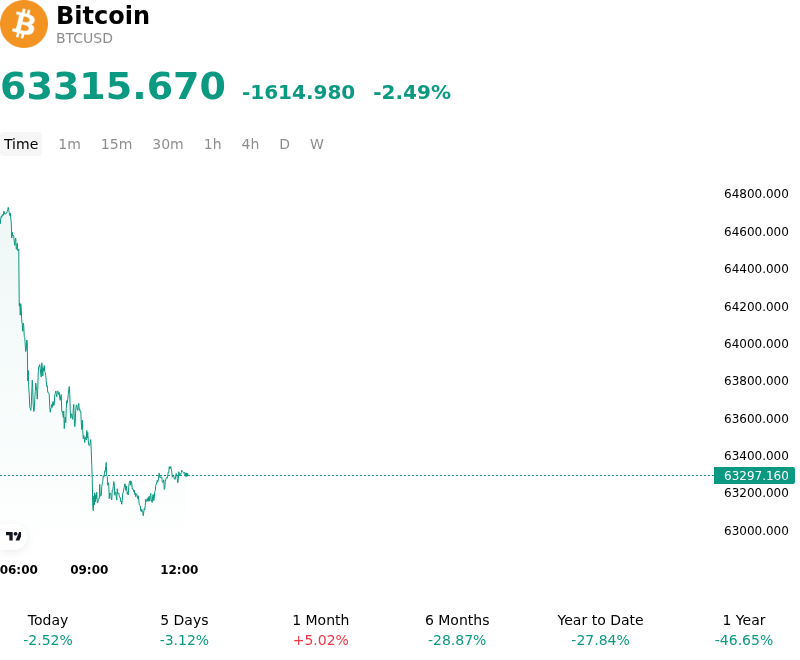
What is driving Bitcoin (BTCUSD)’s stock price down today?
The decline in Bitcoin is primarily driven by a tightening of global liquidity and a shift in institutional risk sentiment ahead of the Federal Reserve's mid-summer policy decision. As investors anticipate a potentially hawkish stance from central bank officials, US Treasury yields have moved higher, exerting downward pressure on the entire digital asset complex. This macro-driven rotation out of risk-sensitive assets has been amplified by a strengthening US dollar, which historically maintains an inverse correlation with Bitcoin's performance as a store-of-value asset.
Institutional activity through spot Bitcoin ETFs has shown a notable cooling, with net outflows signaling a temporary exhaustion of the recent accumulation phase. Professional allocators appear to be de-risking their positions to navigate potential volatility associated with upcoming economic data releases. This reduction in demand from regulated investment vehicles has removed a critical support pillar that previously underpinned the market’s upward momentum, leading to a repricing of the asset’s short-term valuation.
The technical structure of the market has been further weakened by a significant volume of long liquidations in the derivatives space. As price action dipped below psychological support levels, a cascade of forced liquidations triggered additional selling pressure, exhausting the immediate buy-side liquidity. On-chain metrics reveal that while long-term conviction remains relatively stable, short-term holders have begun moving coins to exchanges, suggesting a tactical retreat in response to the shifting macroeconomic backdrop.
Furthermore, the market is monitoring subtle shifts in the regulatory landscape, particularly regarding the oversight of decentralized finance protocols and stablecoin transparency. These concerns, coupled with a broader moderation in risk appetite across global equity markets, have led to a cautious environment. Until there is more clarity regarding the Federal Reserve's path and a stabilization of ETF inflows, Bitcoin remains sensitive to liquidity shocks and fluctuations in the interest rate outlook.
Technical Analysis of Bitcoin (BTCUSD)
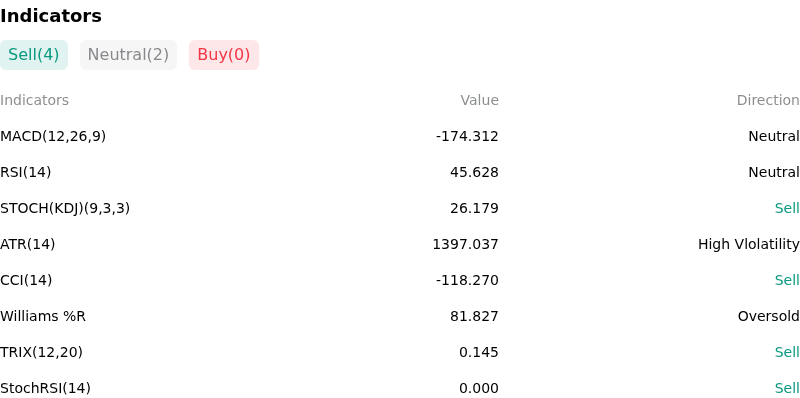
Technically, Bitcoin (BTCUSD) shows a MACD (12,26,9) value of -174.312, indicating a neutral signal. The RSI at 45.628 suggests neutral condition and the Williams %R at 81.827 suggests oversold condition. Please monitor closely.
More details about Bitcoin (BTCUSD)
Recent Events and Risks:
- Government and Trustee Liquidation Pressure: Large-scale on-chain transfers by the German Federal Criminal Police Office (BKA) and the looming distribution of approximately $9 billion in Mt. Gox creditor repayments have introduced a massive supply overhang, with recent exchange deposits signaling imminent sell-side pressure that could overwhelm current buyer depth.
- Institutional Capital Flight: A sustained reversal in Spot Bitcoin ETF flows, characterized by consecutive days of net outflows across major providers like Fidelity and Grayscale, suggests a cooling of institutional appetite and the removal of a critical price support mechanism that previously absorbed retail selling.
- Miner Capitulation and Hashrate Volatility: Post-halving economic pressures have forced smaller mining operations to liquidate BTC holdings to sustain operational costs, as evidenced by declining miner wallet balances and a softening hashrate, which historically precedes periods of increased price instability and downward revaluation.
- Macroeconomic Headwinds and USD Strength: Renewed strength in the U.S. Dollar Index (DXY) and hawkish rhetoric from Federal Reserve officials regarding "higher-for-longer" interest rate policies have tightened global liquidity conditions, increasing the downside risk for non-yielding digital assets as investors rotate toward lower-risk treasury instruments.
Recommended Articles


