

KLA Corp Stock (KLAC) Moved Up by 4.13% on Jun 17: A Full Analysis
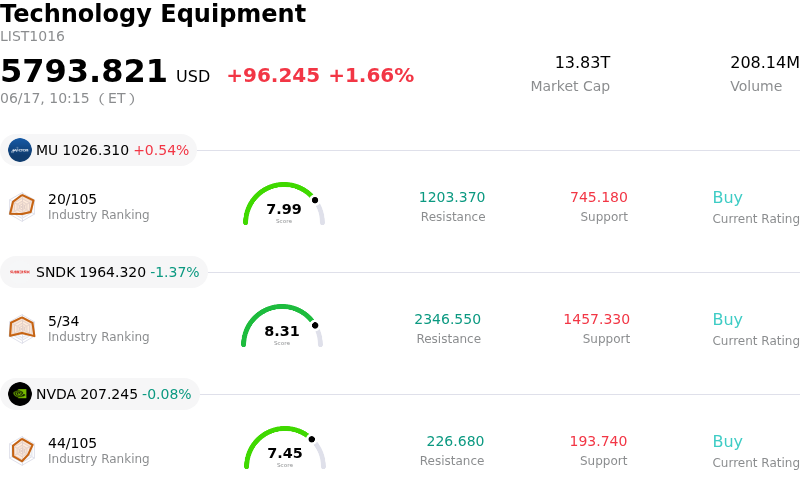
KLA Corp (KLAC) moved up by 4.13%. The Technology Equipment sector is up by 1.66%. The company outperformed the industry. Top 3 stocks by turnover in the sector: Micron Technology Inc (MU) up 0.54%; SanDisk Corporation (SNDK) down 0.74%; NVIDIA Corp (NVDA) down 0.08%.
What is driving KLA Corp (KLAC)’s stock price up today?
The upward movement of KLA Corporation on the current trading day is primarily driven by a significant analyst upgrade and price target hike from Citigroup, alongside a sharp technical rebound from oversold conditions. These factors have collectively reinvigorated investor confidence in the semiconductor equipment giant, reversing the short-term profit-taking pressure seen earlier in the week.
Citigroup raised its price target for KLA Corporation to two hundred ninety dollars, up from two hundred six dollars and forty cents on a post-split basis, following an upward revision of its global wafer fab equipment spending model. The investment bank anticipates a massive surge in capital expenditure by hyperscalers through 2028, fueled largely by the accelerating adoption of agentic artificial intelligence. This technological transition is causing a structural shift in memory and logic chip demands, creating industry-wide capacity constraints. As semiconductor manufacturers aggressively scale up their leading-edge facilities to resolve these constraints, demand for KLA's specialized inspection and metrology tools is projected to expand significantly.
In addition to these fundamental catalysts, technical indicators paved the way for a sharp intraday reversal. KLA recently executed a ten-for-one forward stock split on June 11, which was initially met with a brief phase of institutional profit-taking. The subsequent pullback pushed the company's short-term Relative Strength Index into deeply oversold territory. This technical exhaustion triggered systematic buy signals, drawing in retail and institutional investors who viewed the discount as an attractive entry point. The rebound is further supported by KLA's solid financial health, marked by sequential revenue guidance, a massive seven billion dollar share buyback program, and its seventeenth consecutive year of dividend increases.
Finally, positive momentum within the broader semiconductor capital equipment sector has provided strong tailwinds. Recent industry reports show record global semiconductor equipment billings, highlighting the relentless pace of investment in advanced packaging and next-generation logic chips. As a critical enabler of the global artificial intelligence hardware ecosystem, KLA remains positioned to benefit directly from these secular capital expenditure expansions, driving the stock's strong positive performance.
Technical Analysis of KLA Corp (KLAC)
Technically, KLA Corp (KLAC) shows a MACD (12,26,9) value of -449.610, indicating a sell signal. The RSI at 18.671 suggests oversold condition and the Williams %R at 99.198 suggests oversold condition. Please monitor closely.
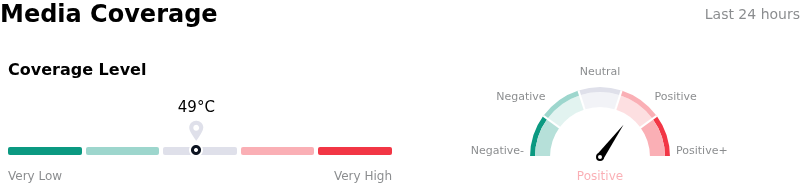
Media Coverage of KLA Corp (KLAC)
In terms of media coverage, KLA Corp (KLAC) shows a coverage score of 49, indicating a moderate level of media attention. The overall market sentiment index is currently in bullish zone.
Fundamental Analysis of KLA Corp (KLAC)
KLA Corp (KLAC) is in the Technology Equipment industry. Its latest annual revenue is $12.16B, ranking 15 in the industry. The net profit is $4.06B, ranking 11 in the industry. Company Profile
Over the past month, multiple analysts have rated the company as Buy, with an average price target of $187.10, a high of $250.00, and a low of $110.00.
More details about KLA Corp (KLAC)
Company Specific Risks:
- Stretched Valuation Post-Stock Split: Following the 10-for-1 forward stock split effective June 12, 2026, KLA's trailing P/E multiple expanded to over 67x (significantly above its five-year median of 26x). This extreme premium leaves no margin of safety, prompting profit-taking and driving a swift pullback from its recent 52-week highs.
- Aggressive Insider Selling and Free Cash Flow Contraction: Recent SEC filings reveal notable insider divestments, including CEO Richard Wallace selling approximately $10 million in stock and overall insider sales reaching $19.7 million over the past quarter. This lack of insider buying is exacerbated by a fundamental red flag: a 37% year-over-year contraction in Q3 fiscal 2026 free cash flow, despite strong headline GAAP earnings.
- Surge in Bearish Options Activity: Market data from June 15, 2026, exposed a massive shift in defensive sentiment, with put option volume surging by 1,456% above the typical daily average to 39,161 contracts. This heavy institutional hedging signals elevated near-term market expectations of a deeper technical correction.
- Geopolitical Revenue Drag from Export Controls: Tightening government export restrictions targeting high-tech semiconductor shipments to China remain a severe top-line headwind, with management estimating a direct negative impact of $300 million to $350 million in forfeited revenue for the fiscal year.
Recommended Articles


