

Solana (SOLUSD) Is down 1.08% on Jun 17: Key Drivers to Watch
Solana (SOLUSD) is down 1.08% at Jun 17 02:30(ET), now at $72.35, with a 7-day up of 14.71%.
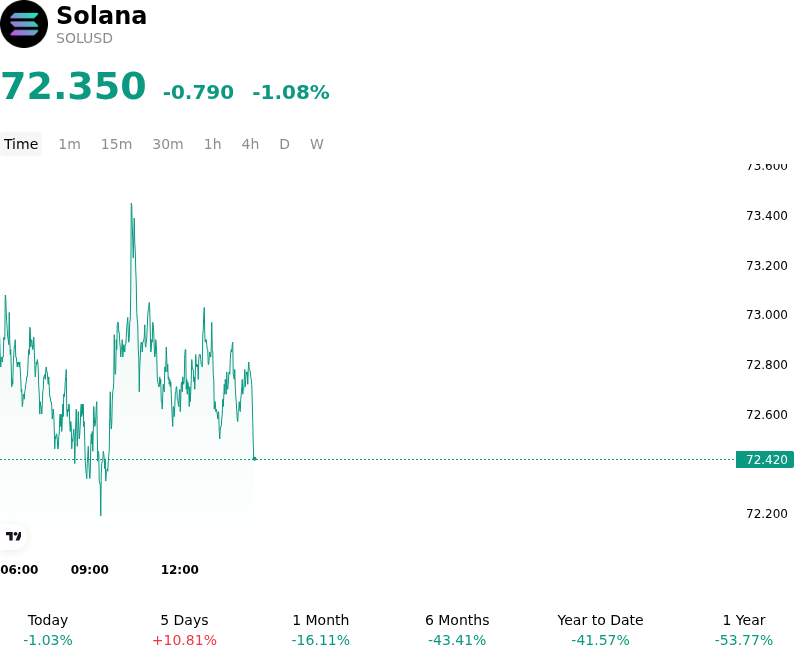
What is driving Solana (SOLUSD)’s stock price down today?
The intraday volatility in the Solana market is primarily driven by macro-liquidity constraints and heightened investor anxiety surrounding the Federal Open Market Committee meeting. Markets are preparing for a potentially hawkish shift in the Federal Reserve’s Summary of Economic Projections, with expectations mounting that the central bank will signal a higher-for-longer interest rate path and eliminate projected rate cuts for the remainder of the year. The debut of a new Federal Reserve leadership structure has introduced additional monetary policy uncertainty, prompting institutional and retail investors to temporarily reduce exposure to high-beta digital assets.
This cautious macroeconomic backdrop coincides with structural headwinds across the broader digital asset ecosystem. Despite the prior launch of spot Solana exchange-traded funds in the United States and United Kingdom, institutional inflows have slowed and remain insufficient to fully offset the systemic sell pressure currently affecting the cryptocurrency market. Furthermore, a substantial portion of speculative risk capital continues to be absorbed by traditional equities, particularly the artificial intelligence sector, which has diverted liquidity away from layer-one blockchain ecosystems.
From a positioning and on-chain perspective, Solana has been attempting to establish a consolidation floor following a prolonged correction from its previous cycle highs. Although there are signs of stabilizing on-chain activity and fee revenue, derivatives markets reflect a highly defensive posture. Funding rates have normalized, and open interest remains depressed, indicating a lack of leverage-backed conviction among traders. While long-term network metrics and prospective upgrades point to structural resilience, Solana’s near-term price action remains constrained by restrictive global monetary conditions and a general risk-off sentiment in global financial markets.
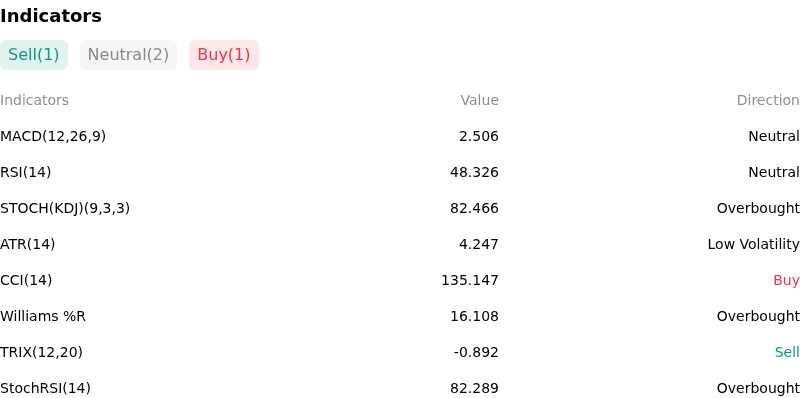
Technical Analysis of Solana (SOLUSD)
Technically, Solana (SOLUSD) shows a MACD (12,26,9) value of 2.506, indicating a neutral signal. The RSI at 48.326 suggests neutral condition and the Williams %R at 16.108 suggests overbought condition. Please monitor closely.
More details about Solana (SOLUSD)
Recent Events and Risks:
- Institutional ETF Outflows and Goldman Sachs Capitulation: Recent regulatory disclosures confirming that Goldman Sachs completely liquidated its $108 million Solana ETF exposure have heavily damaged institutional sentiment. This complete exit, combined with spot Solana ETFs switching to net weekly capital outflows, has removed key price support and forced the token down to retest critical support levels.
- Compounding Spot Market Supply Shocks: Supply-side pressure has escalated following aggressive selling by major ecosystem participants, including the memecoin deployer platform Pump.fun offloading over 100,000 SOL (~$8.5 million). Additionally, an anonymous whale transferred 1.35 million SOL (worth $84.06 million) to Coinbase Institutional, saturating the sell side of the order book.
- On-Chain Capital Erosion and Network Congestion: Solana's DeFi Total Value Locked (TVL) plunged nearly 10% over the week, accompanied by structural capitulation in long-term hodler supply, which dropped from 3.27 million to 2.36 million SOL. High-frequency trading activity also continues to trigger bouts of network congestion, causing transaction drops and creating operational risks for market participants.
- Regulatory Compliance Anxieties Under the CLARITY Act: Ongoing legislative debates in the U.S. Senate over Section 604 of the CLARITY Act have introduced fresh regulatory anxieties. Because Solana does not currently benefit from the explicit statutory commodity classification that other major digital assets receive, its regulatory status remains precarious and dependent on existing, shifting agency guidance.
Recommended Articles


