

Ge Vernova Inc Stock (GEV) Moved Down by 4.33% on May 18: Facts Behind the Movement
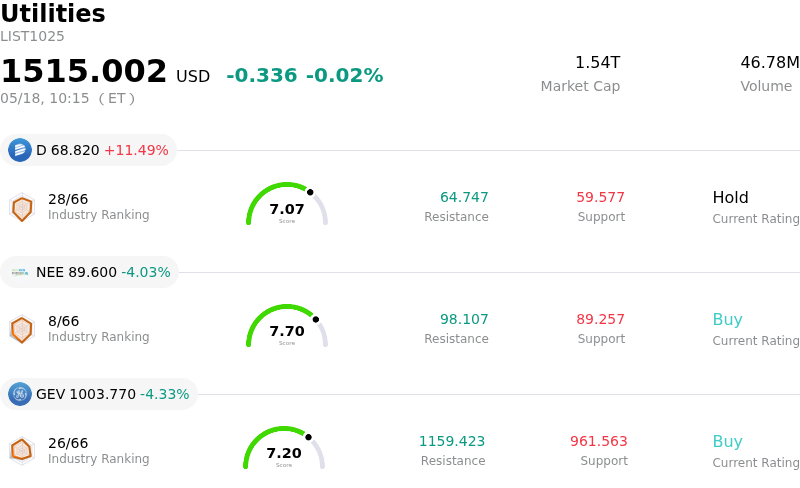
Ge Vernova Inc (GEV) moved down by 4.33%. The Utilities sector is down by 0.02%. The company underperformed the industry. Top 3 stocks by turnover in the sector: Dominion Energy Inc (D) up 11.49%; Nextera Energy Inc (NEE) down 4.03%; Ge Vernova Inc (GEV) down 4.33%.
What is driving Ge Vernova Inc (GEV)’s stock price down today?
GE Vernova experienced a notable decline during today’s trading session, despite reporting exceptionally strong first-quarter 2026 financial results and issuing optimistic forward guidance. The company announced it significantly surpassed analyst estimates for earnings per share and revenue in the first quarter of 2026, with adjusted EPS reaching $2.01 against expectations of $1.67, and revenue increasing by over 16% year-over-year to more than $9.3 billion. This robust performance was further highlighted by an 87% year-over-year surge in adjusted EBITDA and a substantial increase in net profit.
Adding to the positive financial data, GEV reported a significant boost to its backlog, adding $13 billion in new orders during the quarter, bringing the total to $163 billion. The company now anticipates reaching its $200 billion backlog target a year ahead of schedule, by 2027. Management also raised its full-year 2026 revenue guidance to a range of $44.5-$45.5 billion and increased its free cash flow target to between $6.5 billion and $7.5 billion. These strong operational metrics and an improved outlook were largely driven by heightened demand for power solutions, especially from the burgeoning AI data center sector, which has bolstered orders for gas turbines and grid equipment.
Despite these overwhelmingly positive fundamental announcements, the observed intraday price decrease suggests that market dynamics or investor sentiment may have played a significant role. One potential factor could be profit-taking by investors who had positioned themselves ahead of the earnings release, especially given the stock's strong performance leading up to this point. While analyst ratings generally remain highly favorable, with a consensus of "Moderate Buy" and numerous price target increases following the strong quarter, some market participants might be reassessing valuation levels after a significant run-up. Additionally, technical trading signals observed for GEV on this date indicated a testing of resistance levels, which could have triggered selling pressure. This divergence between strong underlying business performance and an immediate negative stock reaction could also reflect a "buy the rumor, sell the news" phenomenon, where positive expectations were already largely priced into the stock.
Technical Analysis of Ge Vernova Inc (GEV)
Technically, Ge Vernova Inc (GEV) shows a MACD (12,26,9) value of [36.61], indicating a neutral signal. The RSI at 51.69 suggests neutral condition and the Williams %R at -80.82 suggests oversold condition. Please monitor closely.
Fundamental Analysis of Ge Vernova Inc (GEV)
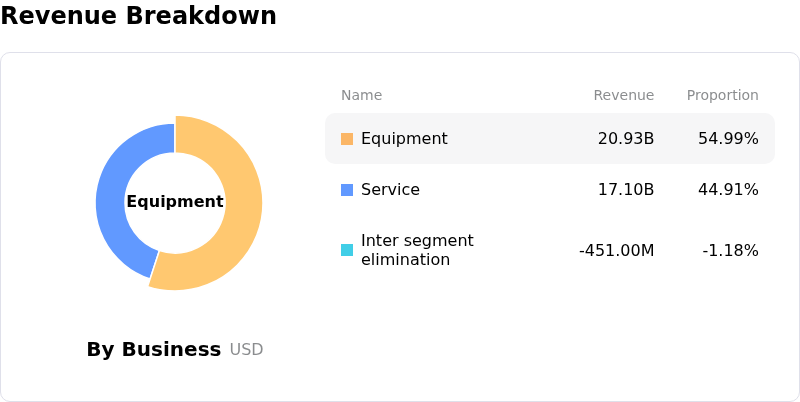
Ge Vernova Inc (GEV) is in the Utilities industry. Its latest annual revenue is $38.07B, ranking 2 in the industry. The net profit is $4.88B, ranking 4 in the industry. Company Profile
Over the past month, multiple analysts have rated the company as Buy, with an average price target of $1211.34, a high of $1424.00, and a low of $836.00.
More details about Ge Vernova Inc (GEV)
Company Specific Risks:
- Persistent underperformance and widening losses within the Wind segment are anticipated to be further compounded by a projected $250-350 million impact from global tariffs in 2026, leading to approximately $400 million in segment EBITDA losses.
- GE Vernova faces significant vulnerability to global supply chain disruptions, including issues with raw material availability and logistical delays, which are expected to increase input costs and adversely affect production timelines and margins.
- The stock exhibits an elevated valuation, trading at approximately 40x next twelve months EV/EBITDA, rendering it highly susceptible to substantial downside risk from any operational setbacks or a deceleration in projected growth.
- Limited near-term growth opportunities are evident due to a substantial portion of the company's capacity being contracted through 2030, alongside execution risks in converting its significant order backlog into revenue amidst potential permit delays, customer financing hurdles, and cost inflation in large power projects.
Recommended Articles


