Bitcoin Accumulating, On Course Of Breaking $74,000 Despite Bear Scare: Analyst

Mitrade
Trending Articles
coverImg
Source: DepositPhotos

Bitcoin remains shaky when writing, down 13% from its all-time high. However, despite the short-term uncertainty, one analyst on X remains bullish on the world’s most valuable coin, citing current developments from a technical perspective.


Is Bitcoin Inside A Wyckoff Re-accumulation Phase?


Taking to X, the analyst believes Bitcoin might be forming a Wyckoff Re-accumulation pattern on the daily chart. This means the coin could consolidate in a trading range before catapulting higher in the days ahead.

BTC accumulating | Source: Analyst on X


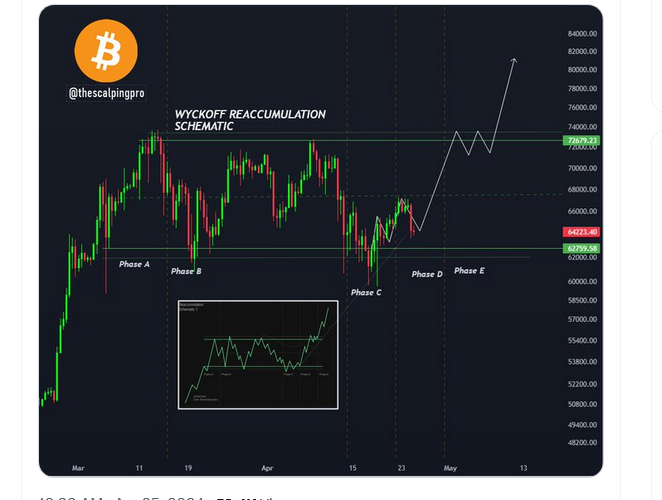
Technically, the Wyckoff Re-accumulation pattern identifies a phase when it is assumed that big players, primarily whales, are quietly buying at a discount. Price action remains muted and inside a defined range whenever they do this.


Currently, Bitcoin prices are inside a zone marked by support, at $60,000 on the lower end and all-time highs, at around $74,000 on the upper end.


Though the momentum remains bullish, bulls’ failure to edge higher or dump below the psychological level suggests that some big players might be deliberately keeping prices at spot rates. 


This preview considers the failure of bears to confirm losses of April 13. Even though BTCUSDT prices are still trapped inside this bear bar, it is clear that bulls flew back to support prices.


The only time sellers will be in control is if prices collapse below April 13 lows and $60,000 at the back of increasing volume. As it is, buyers have a chance and are trending inside a broad range, capped at $73,800.

Bitcoin price trending sideways on the daily chart | Source: BTCUSDT on Binance, TradingView


Is BTC Preparing For Gains?


Though optimism exists, the leg up would be sparked by technical but most fundamental factors. Following last weekend’s Halving on April 20, the network’s daily emissions have decreased by 50%. With a reduced supply, the resulting scarcity could drive prices higher, assuming demand remains. 


However, whether this spike will occur in the next weeks or months remains to be seen. Once halving occurs, Bitcoin usually breaks previous all-time highs, in this case, $73,800. If this historical printout is respected, BTC could soar to fresh all-time highs by the end of the year.


Increasing institutional adoption via spot Bitcoin exchange-traded funds (ETFs) will drive a big part of this expected. As of April 24, Lookonchain data shows that GBTC decreased 538 BTC while BlackRock and other spot ETF issuers added 569 BTC. 

BTC accumulation by spot ETF issuers | Source: Lookonchain via X

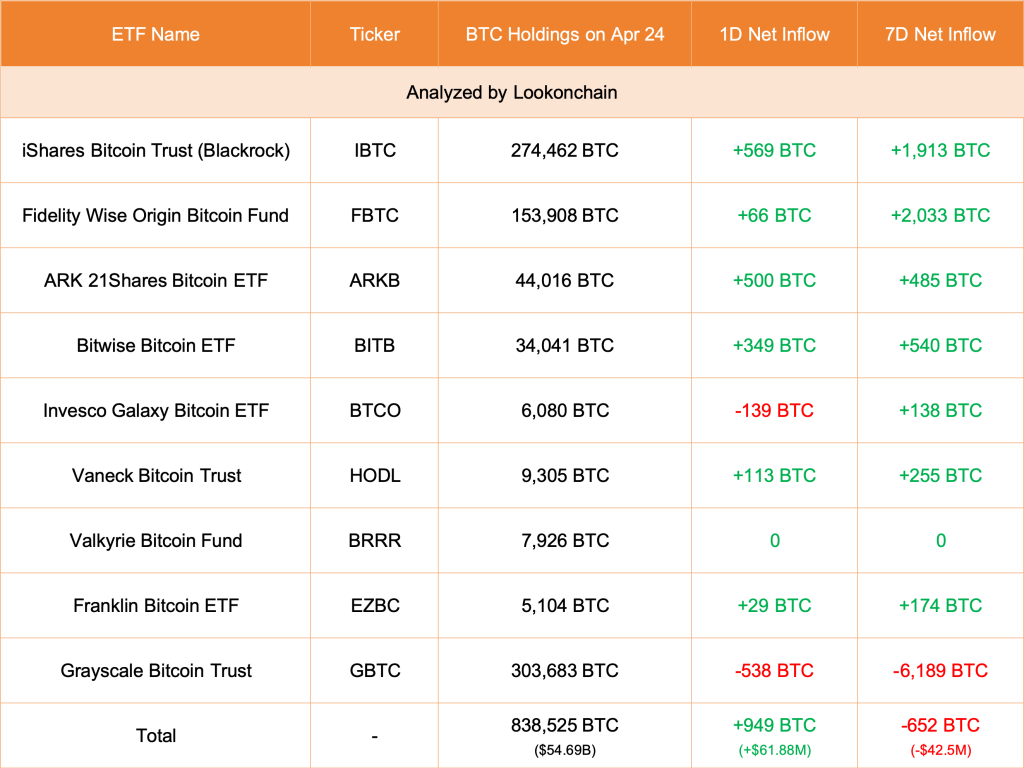
Inflow has reduced, but assuming prices pick up, it is likely that more users will be keen to add BTC to their portfolios. This, as a result, could drive prices higher.  

Read more

  • Gold remains bid as lack of Fed clarity and geopolitical frictions persist
  • * The content presented above, whether from a third party or not, is considered as general advice only.  This article should not be construed as containing investment advice, investment recommendations, an offer of or solicitation for any transactions in financial instruments.

    goTop
    quote
    Related Articles
    placeholder
    Senate Delays Crypto Market Structure Hearings to Early 2026The Senate Banking Committee has postponed cryptocurrency market structure hearings until 2026, citing ongoing bipartisan negotiations.
    Author  Mitrade
    19 hours ago
    The Senate Banking Committee has postponed cryptocurrency market structure hearings until 2026, citing ongoing bipartisan negotiations.
    placeholder
    Bitcoin Slides 5% as Sellers Lean In — Can BTC Reclaim $88,000?Bitcoin has dropped back below $88,000 after rolling over from $90,500, with price still trading under the 100-hour Simple Moving Average. The sell-off found a floor at $85,151, and BTC is now consolidating near that base, but rebounds are facing pressure from a bearish trend line around $89,000. Bulls need to retake $88,000–$89,000 to ease downside risk; failure to do so keeps $85,500–$85,000 and then $83,500 in play, with $80,000 as the deeper “line in the sand.” Bitcoin (BTC) is back in damage-control mode after a sharp pullback wiped out recent gains. The price failed to reclaim the $90,000–$90,500 band, rolled over, and slid through $88,500 before briefly dipping under $87,000. Buyers did show up around $85,000, but the rebound so far looks more like stabilization than a clear trend reversal. Bitcoin dips hard, finds a bid near $85,000(h3) BTC’s latest move lower began when it couldn’t build follow-through above $90,000 and $90,500. Once that upside stalled, sellers took control and pushed price down through $88,500. The slide accelerated enough to spike below $87,000, but the market didn’t free-fall. Bulls defended the $85,000 zone, printing a low at $85,151. Since then, Bitcoin has been consolidating below the 23.6% Fibonacci retracement of the drop from the $93,560 swing high to the $85,151 low — a clue that the bounce is still shallow and that sellers haven’t fully backed off yet. Structurally, BTC is still on the back foot: It’s trading below $88,000, and It remains below the 100-hour Simple Moving Average, keeping short-term trend pressure pointed downward. Resistance is layered, and $89,000 is the problem area(h3) If bulls try to turn this into a recovery, they’ll have to climb through multiple ceilings in quick succession. First, BTC faces resistance around $87,150, followed by a more meaningful barrier near $87,500. From there, the market’s attention snaps back to $88,000 — the level BTC just lost and now needs to reclaim. A close back above $88,000 would improve the tone, but it doesn’t solve the bigger issue: there’s a bearish trend line on the hourly BTC/USD chart (Kraken feed) with resistance near $89,000, which also lines up with the next technical hurdle. If BTC can push through $89,000 and hold, the rebound could extend toward $90,000, with follow-through targets at $91,000 and $91,500. But until price clears that $88,000–$89,000 zone, rallies are at risk of being sold rather than chased. If BTC fails to reclaim resistance, the downside path is clear(h3) The near-term bear case is simple: if Bitcoin can’t climb back above the $87,000 area and keep traction, sellers may attempt another leg lower. Support levels line up like this: Immediate support: $85,500 First major support: $85,000 Next support: $83,500 Then $82,500 in the near term Below that, the major “don’t break this” level is still $80,000. If BTC slips under $80,000, the risk of acceleration to the downside increases significantly — not because it’s magic, but because it’s the kind of psychological and structural level that tends to trigger forced de-risking. Indicators: momentum still leans bearish(h3) The intraday indicators aren’t offering much comfort yet: Hourly MACD is losing pace in the bearish zone. Hourly RSI remains below 50, suggesting sellers still have the upper hand on short timeframes. So while the $85,000 defense held for now, the market hasn’t flipped bullish — it’s just stopped bleeding.
    Author  Mitrade
    22 hours ago
    Bitcoin has dropped back below $88,000 after rolling over from $90,500, with price still trading under the 100-hour Simple Moving Average. The sell-off found a floor at $85,151, and BTC is now consolidating near that base, but rebounds are facing pressure from a bearish trend line around $89,000. Bulls need to retake $88,000–$89,000 to ease downside risk; failure to do so keeps $85,500–$85,000 and then $83,500 in play, with $80,000 as the deeper “line in the sand.” Bitcoin (BTC) is back in damage-control mode after a sharp pullback wiped out recent gains. The price failed to reclaim the $90,000–$90,500 band, rolled over, and slid through $88,500 before briefly dipping under $87,000. Buyers did show up around $85,000, but the rebound so far looks more like stabilization than a clear trend reversal. Bitcoin dips hard, finds a bid near $85,000(h3) BTC’s latest move lower began when it couldn’t build follow-through above $90,000 and $90,500. Once that upside stalled, sellers took control and pushed price down through $88,500. The slide accelerated enough to spike below $87,000, but the market didn’t free-fall. Bulls defended the $85,000 zone, printing a low at $85,151. Since then, Bitcoin has been consolidating below the 23.6% Fibonacci retracement of the drop from the $93,560 swing high to the $85,151 low — a clue that the bounce is still shallow and that sellers haven’t fully backed off yet. Structurally, BTC is still on the back foot: It’s trading below $88,000, and It remains below the 100-hour Simple Moving Average, keeping short-term trend pressure pointed downward. Resistance is layered, and $89,000 is the problem area(h3) If bulls try to turn this into a recovery, they’ll have to climb through multiple ceilings in quick succession. First, BTC faces resistance around $87,150, followed by a more meaningful barrier near $87,500. From there, the market’s attention snaps back to $88,000 — the level BTC just lost and now needs to reclaim. A close back above $88,000 would improve the tone, but it doesn’t solve the bigger issue: there’s a bearish trend line on the hourly BTC/USD chart (Kraken feed) with resistance near $89,000, which also lines up with the next technical hurdle. If BTC can push through $89,000 and hold, the rebound could extend toward $90,000, with follow-through targets at $91,000 and $91,500. But until price clears that $88,000–$89,000 zone, rallies are at risk of being sold rather than chased. If BTC fails to reclaim resistance, the downside path is clear(h3) The near-term bear case is simple: if Bitcoin can’t climb back above the $87,000 area and keep traction, sellers may attempt another leg lower. Support levels line up like this: Immediate support: $85,500 First major support: $85,000 Next support: $83,500 Then $82,500 in the near term Below that, the major “don’t break this” level is still $80,000. If BTC slips under $80,000, the risk of acceleration to the downside increases significantly — not because it’s magic, but because it’s the kind of psychological and structural level that tends to trigger forced de-risking. Indicators: momentum still leans bearish(h3) The intraday indicators aren’t offering much comfort yet: Hourly MACD is losing pace in the bearish zone. Hourly RSI remains below 50, suggesting sellers still have the upper hand on short timeframes. So while the $85,000 defense held for now, the market hasn’t flipped bullish — it’s just stopped bleeding.
    placeholder
    Macro Analysts: Hawkish Japan Could Push Bitcoin Below $70KAnalysts predict Bitcoin may face further declines towards the $70,000 mark if the Bank of Japan raises interest rates as expected.
    Author  Mitrade
    Dec 15, Mon
    Analysts predict Bitcoin may face further declines towards the $70,000 mark if the Bank of Japan raises interest rates as expected.
    placeholder
    Fed Cuts Rates: Bitcoin Rallies Then Retreats - Bear Market Ahead?TradingKey - Fed Rate Cut Fails to Buoy Bitcoin, Signaling Bull Market's End?Early on December 11,the Federal Reserve delivered an expected 25 basis point rate cut.Bitcoin (BTC) briefly surged to $94,
    Author  TradingKey
    Dec 11, Thu
    TradingKey - Fed Rate Cut Fails to Buoy Bitcoin, Signaling Bull Market's End?Early on December 11,the Federal Reserve delivered an expected 25 basis point rate cut.Bitcoin (BTC) briefly surged to $94,
    placeholder
    Bitcoin Breaks Above $94K Again: Is the Bull Market Back?​Bitcoin has reclaimed the $94,000 mark, suggesting a possible short-term bullish uptrend, despite concerns over liquidity.
    Author  Mitrade
    Dec 10, Wed
    ​Bitcoin has reclaimed the $94,000 mark, suggesting a possible short-term bullish uptrend, despite concerns over liquidity.

    Bitcoin Related Articles

    • Trading Chart Patterns:Ultimate Guide to Price Action
    • How to Day Trade Crypto? Simplest Day Trading Strategy Ever
    • Places that Provide Cheapest Ways to Buy Bitcoin In 2025
    • 10 Best Crypto With Most Potential to Buy and invest in 2025 - Top Picks from Expert Traders
    • Top 10 Bitcoin Mining Apps for Android & iOS During 2024
    • How To Buy Bitcoin In Malaysia? Top 7 Best Crypto Exchanges & Trading Apps

    Click to view more