




Crude Oil starts the week on the backfoot, sinking further below $75.00.
Traders see OPEC revising their growth forecasts to the downside for a third time.
The US Dollar Index orbits around 103.00 and is looking for a catalyst to move higher.
Crude Oil trades on the back foot on Monday following the release of the monthly Organization of the Petroleum Exporting Countries (OPEC) report. Events over the weekend remained rather calm, with no real big military movements from Israel in Lebanon. However, Iran confirmed this Monday that communication with the United States (US) via Oman has stopped, Bloomberg reports.
The US Dollar Index (DXY), which tracks the performance of the Greenback against six other currencies, is orbiting around 103.00 and is looking to advance. The question is whether or how it will do that with a very light US calendar this week. All eyes will then rather be on the European Central Bank decision on Thursday as the main driver to push the US Dollar, possibly higher beyond 103.00.
At the time of writing, Crude Oil (WTI) trades at $7.55 and Brent Crude at $77.35.
Oil news and market movers: Strike three for OPEC
The US broadened the scope of its sanctions on Iran’s oil and gas sectors in response to a ballistic missile attack on Israel, Bloomberg reports.
The monthly OPEC report sees OPEC revising down its demand growth forecast for a third time in a row, Reuters reports.
China reports more sluggish demand, with Crude Oil Imports falling 2.8% year-to-date in September, Bloomberg reports.
China failed to convince markets with no real fresh details during the announcement of its stimulus package to boost its economy. Markets dipped lower on the back of it, with Oil already sliding lower by 2% in early Asian trading, Bloomberg reported.
Oil Technical Analysis: OPEC delivers another blow
Crude Oil is receiving a big blow from OPEC, with the conglomerate announcing another downward revision for the third time in a row. China still looks to be struggling and unable to kickstart its economy again. With that in the equation, another downward revision could be made for the next month.
Last week’s false break is to be ignored, as the move was fully paired back. It means that current pivotal levels on the upside are still valid: the red descending trendline in the chart below, and the 100-day Simple Moving Average (SMA) at $75.56 just hovering above it, makes that region very difficult to surpass. Once holding above that zone, the 200-day SMA at $77.17 should refute any further upticks as it did in early trading on Tuesday.
On the downside, there is a similar remark as for the upside with this false break. The rule of thumb is that if there has not been a daily close below the level, it still acts as a support. First is the 55-day SMA at $72.49, which acts as a potential first line of defence. A bit further down, $71.46 (the February 5 low) comes into play as second support before looking back to the $70.00 big figure and $67.11 as ultimate support for traders to buy the dip.
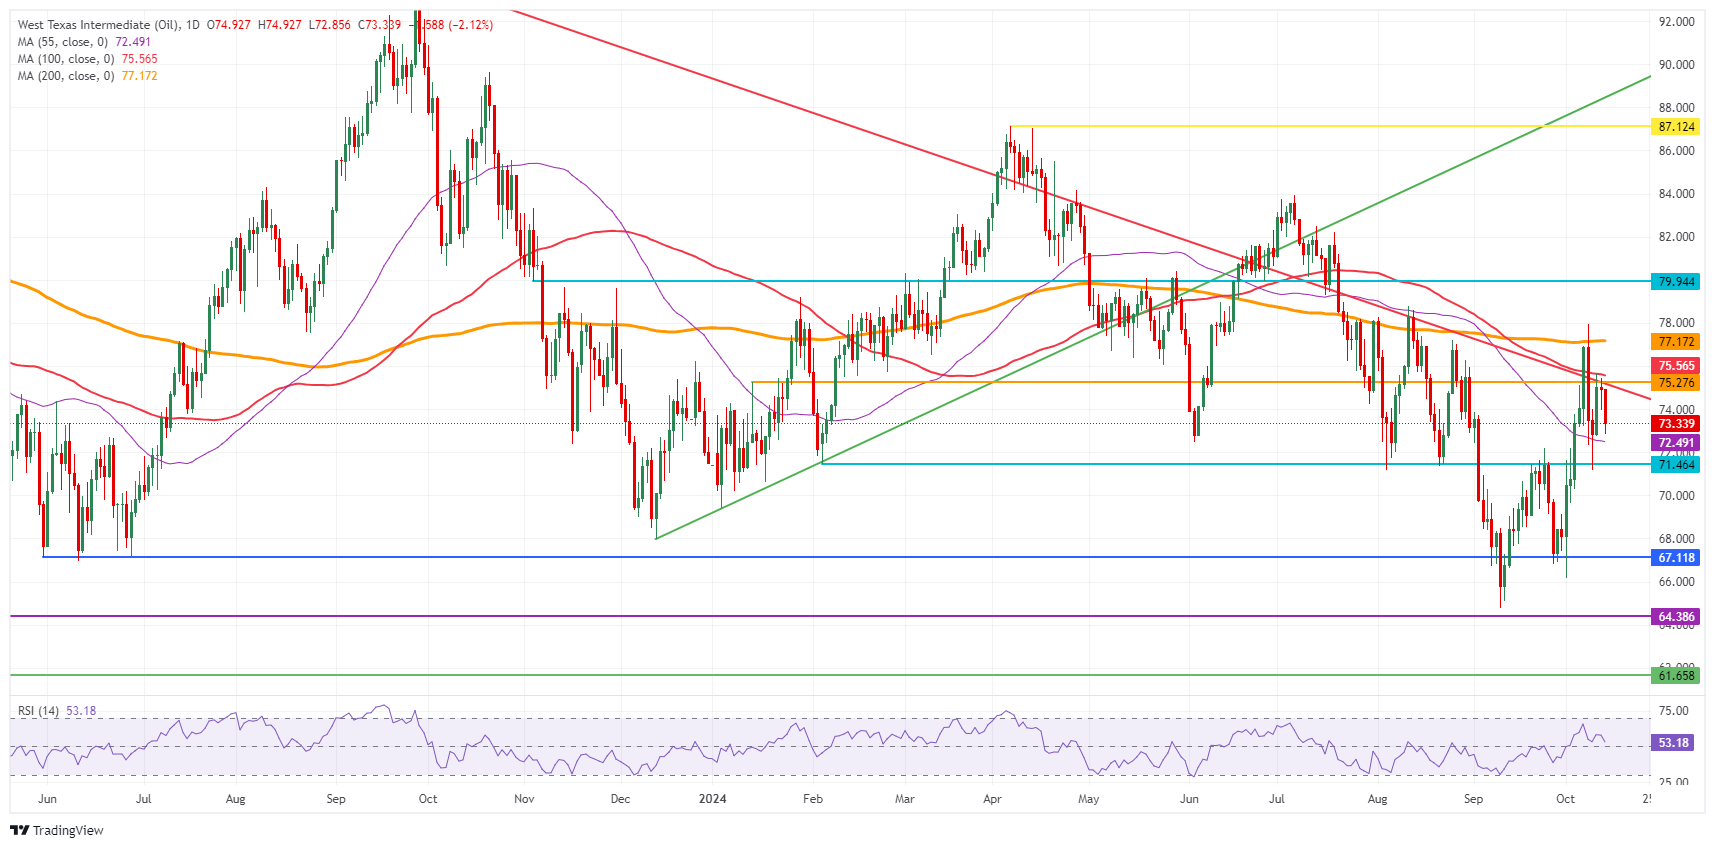
US WTI Crude Oil: Daily Chart
WTI Oil FAQs
WTI Oil is a type of Crude Oil sold on international markets. The WTI stands for West Texas Intermediate, one of three major types including Brent and Dubai Crude. WTI is also referred to as “light” and “sweet” because of its relatively low gravity and sulfur content respectively. It is considered a high quality Oil that is easily refined. It is sourced in the United States and distributed via the Cushing hub, which is considered “The Pipeline Crossroads of the World”. It is a benchmark for the Oil market and WTI price is frequently quoted in the media.
Like all assets, supply and demand are the key drivers of WTI Oil price. As such, global growth can be a driver of increased demand and vice versa for weak global growth. Political instability, wars, and sanctions can disrupt supply and impact prices. The decisions of OPEC, a group of major Oil-producing countries, is another key driver of price. The value of the US Dollar influences the price of WTI Crude Oil, since Oil is predominantly traded in US Dollars, thus a weaker US Dollar can make Oil more affordable and vice versa.
The weekly Oil inventory reports published by the American Petroleum Institute (API) and the Energy Information Agency (EIA) impact the price of WTI Oil. Changes in inventories reflect fluctuating supply and demand. If the data shows a drop in inventories it can indicate increased demand, pushing up Oil price. Higher inventories can reflect increased supply, pushing down prices. API’s report is published every Tuesday and EIA’s the day after. Their results are usually similar, falling within 1% of each other 75% of the time. The EIA data is considered more reliable, since it is a government agency.
OPEC (Organization of the Petroleum Exporting Countries) is a group of 12 Oil-producing nations who collectively decide production quotas for member countries at twice-yearly meetings. Their decisions often impact WTI Oil prices. When OPEC decides to lower quotas, it can tighten supply, pushing up Oil prices. When OPEC increases production, it has the opposite effect. OPEC+ refers to an expanded group that includes ten extra non-OPEC members, the most notable of which is Russia.
Read more
* The content presented above, whether from a third party or not, is considered as general advice only. This article should not be construed as containing investment advice, investment recommendations, an offer of or solicitation for any transactions in financial instruments.


