


Weekly Report: Gold up 4.5%, Brent down 16.4% — three commodity regimes just reset


Gold rose 4.51% last week. Brent fell 16.42% in the same five sessions. Both are commonly sold as inflation hedges, and they gave opposite answers — which is the first sign that the market is not trading inflation at all. It is trading two different regimes: a rate-cycical bid for gold and a supply-premium unwind for oil.
The week's conclusion in one sentence: oil has already flipped regimes, gold is one close away from flipping, and the gold-silver ratio is the tell for whether either move is real.
The regime dashboard
| Signal | This week | Threshold | Status |
|---|---|---|---|
| Gold vs $4,000 | $4,074.90 | $4,000 (round number); $4,197–4,202 (50/100-day) | Approaching — reclaimed, not confirmed |
| Brent vs $100 | $98.32 | $100 (psychological); $104.77 (Oct 28 close) | Flipped — closed below for the first time since September |
| Gold-silver ratio | 78.7 | 80 (2020s average); 63.8 (2026 average) | Approaching — silver still cheap vs gold |
| Copper vs $6.30 | $6.218 | $6.30 (September support) | Approaching — broke and holding below |
| WTI vs $90 | $90.83 | $90 (round number) | Approaching — one close above |
Three signals deserve the work; copper and WTI are supporting evidence, not independent regimes.
Signal one: gold reclaimed $4,000, not the trend
Gold bottomed at $3,869.85 on Oct 30 — a one-year low — and closed the week at $4,074.90, a 4.51% weekly gain and the best week since August. On Monday it traded at $4,107.71, holding above $4,100.
The regime signal is not the bounce. It is that the bounce happened while December hike odds rose from 66% to 77%. Gold does not rally into a hawkish repricing unless the market is buying a different story: not "no more hikes" but "this is the last one." The 50- and 100-day averages at $4,197–4,202 are the confirmation level. A close above them turns the bounce into a trend; failure keeps gold in the $3,870–4,200 range that has contained it since September.
The physical side supports the floor rather than the rally. Central banks bought 321 tonnes in Q3, China's reserves stood at 78.30 million ounces at end-October, and India's Diwali demand window opened on Nov 8. That is a bid under $4,000, not a driver of $4,300.
Signal two: Brent's supply-premium regime is over
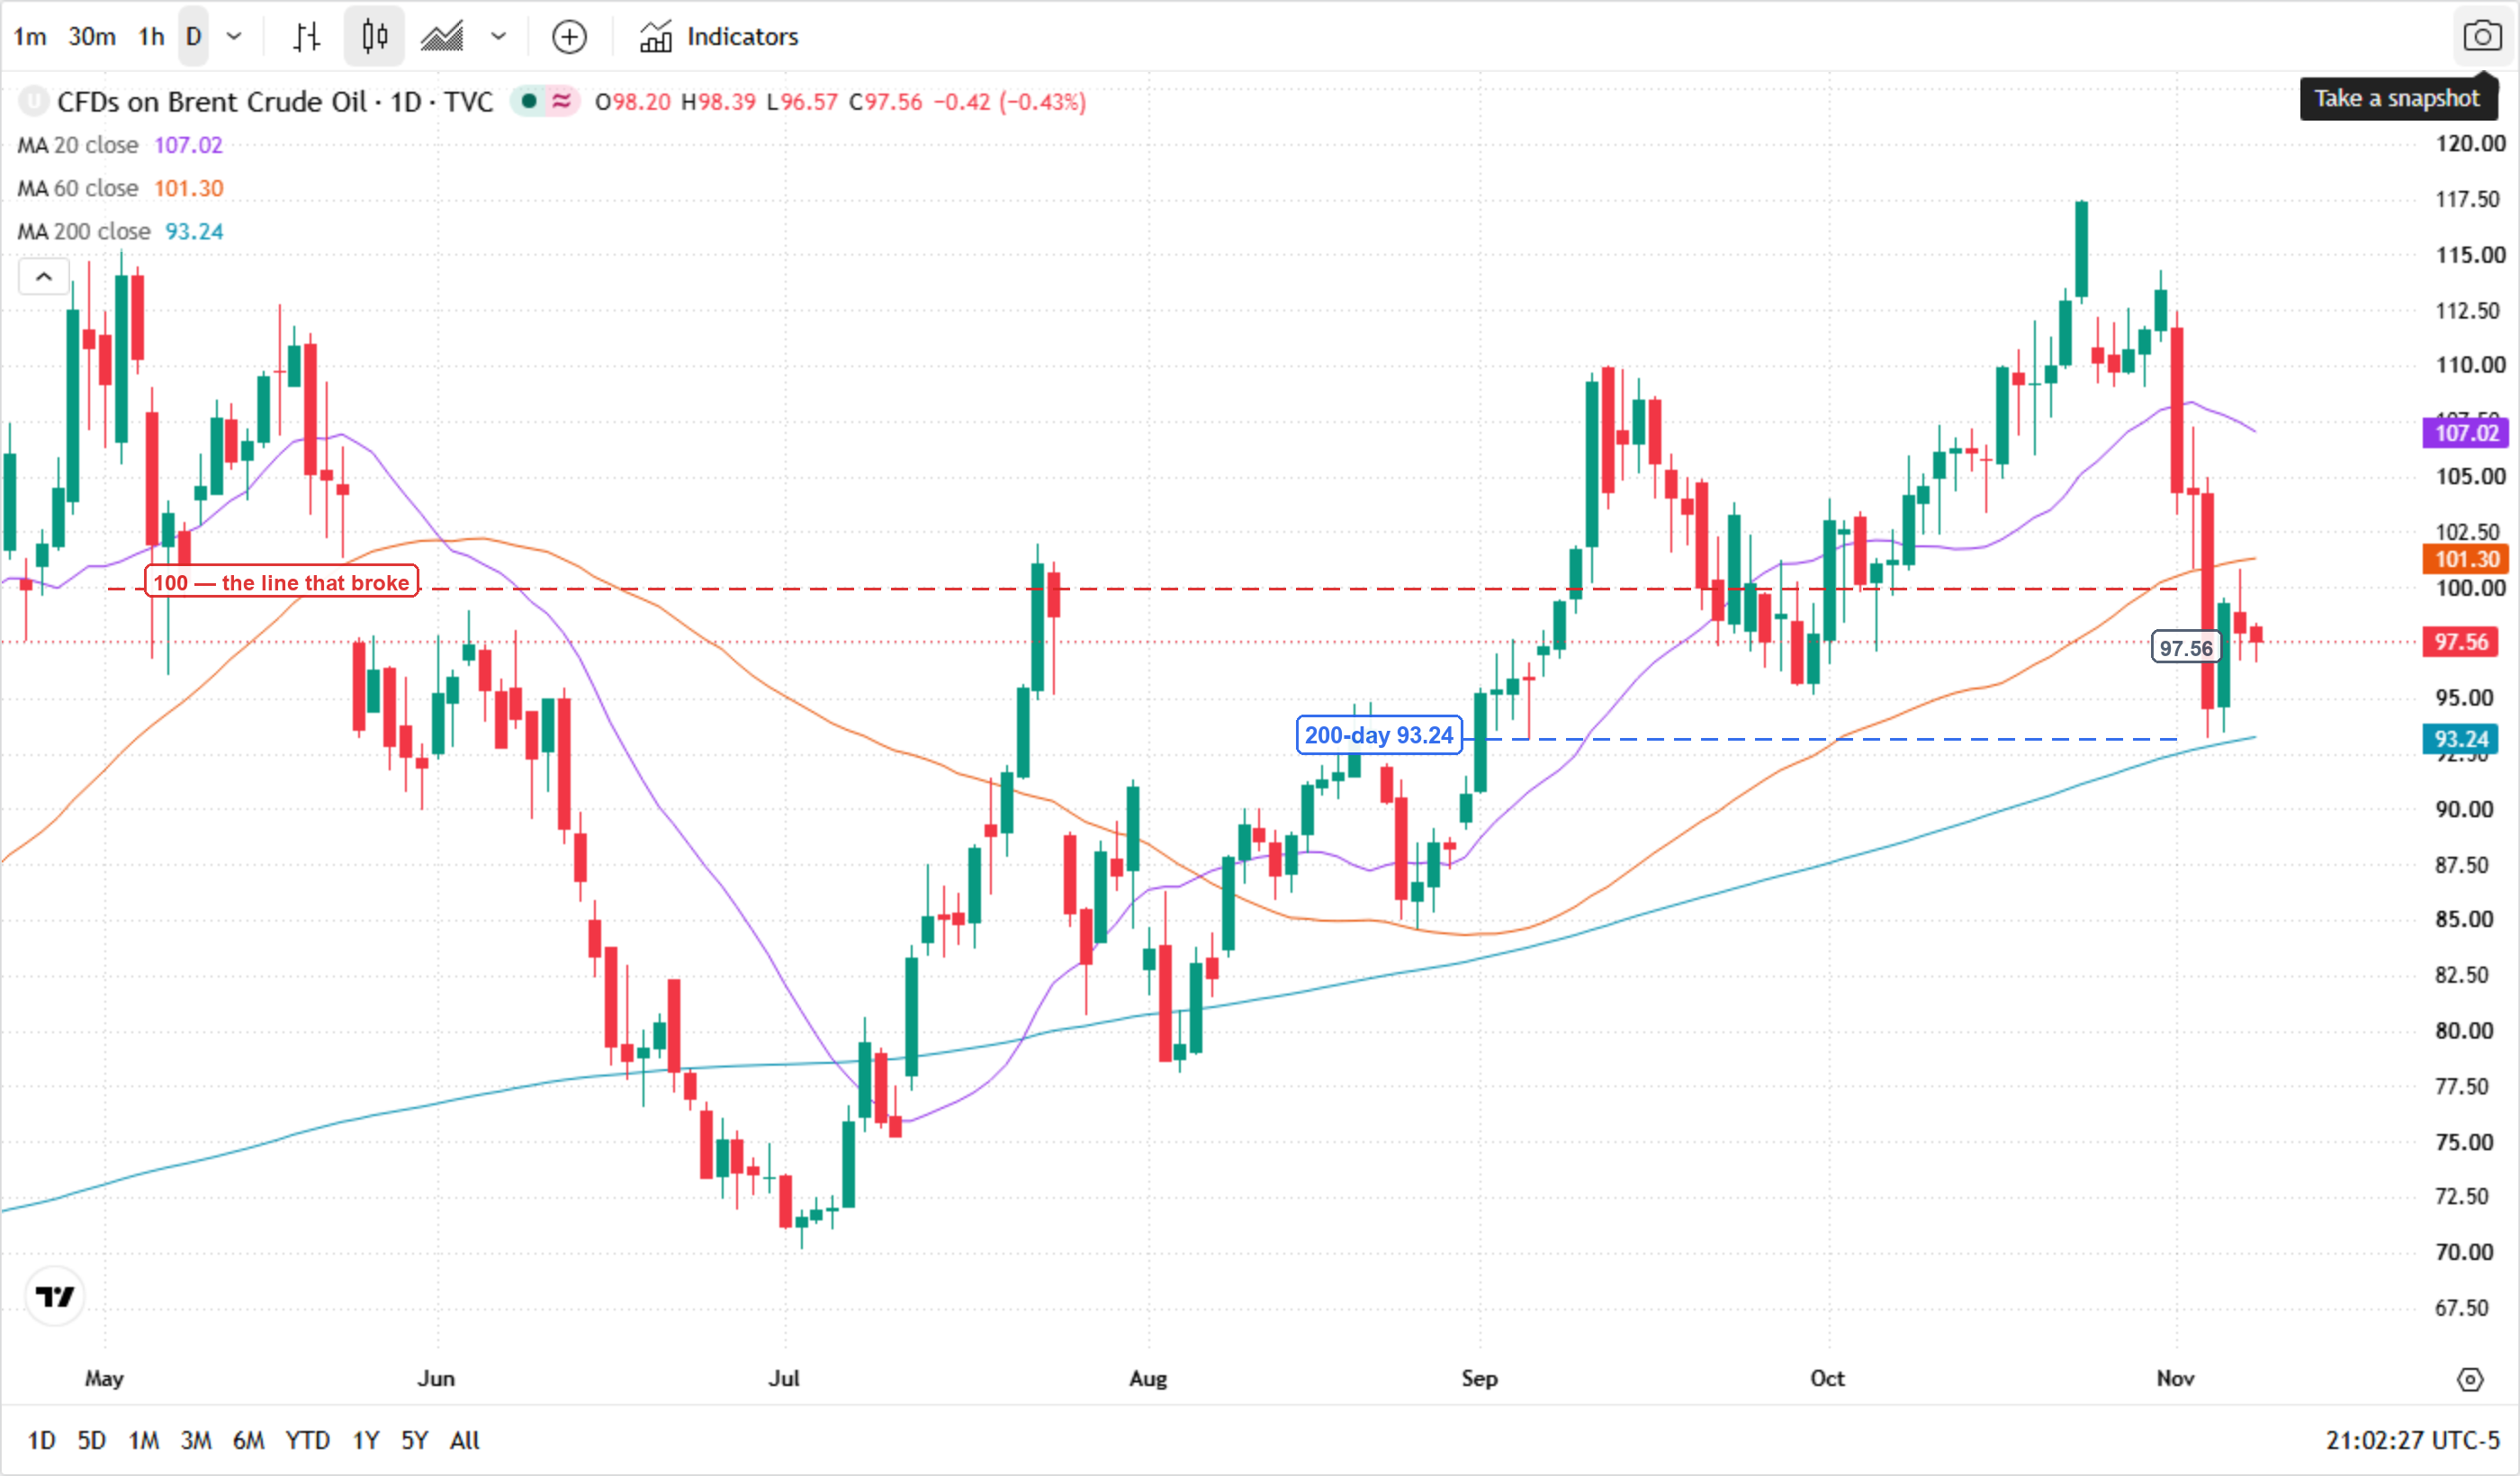
Brent closed at $98.32 on Friday, down 16.42% on the week — the largest weekly decline since 2020 — and WTI fell 12.76% to $90.83. The move erased roughly $20 a barrel of supply premium in five sessions.
This is a completed regime change, not a pullback. The evidence is stacked: US–Iran talks advanced, OPEC+ held December output flat for a third consecutive month on Nov 1, and US four-week demand grew just 0.2% year-on-year. When the only bullish input is geopolitical and that input fades, the price has to find the fundamental floor — and the fundamental floor is where inventories say it is. US crude stocks drew 865,000 barrels to 409.8 million in the week to Oct 30, which is why the fall stopped near $97 rather than extending to $90.
The regime signal to watch now is the curve, not the headline. If the December–January spread stays in backwardation while price holds below $100, the market is saying supply is still tight and the selloff was positioning. If the curve flips to contango, the physical market has confirmed the regime change.
* Chart source: TradingView (TVC:UKOIL, daily)
Read the chart at two levels. 100 is now resistance rather than support — the price broke it on the way down and has not reclaimed it. 93.24, the 200-day, is the last trend line standing; a close below it would turn the regime change into a trend reversal.
Signal three: the gold-silver ratio at 78.7 is the tell
The ratio sits at 78.7, above the 2026 average of 63.8 and close to the 2020s average of 81. Silver rose 5.51% on the week to $51.80 — a strong absolute move that still lagged gold's 4.51% on a much lower base.
The ratio matters because it separates two explanations for gold's rally. If gold is rising on safe-haven demand, silver should lag and the ratio should widen toward 80. If gold is rising on liquidity and real-rate expectations, silver should outperform and the ratio should compress. Last week it did neither decisively: both metals rose, the ratio held near 77–79, and the signal stayed neutral.
Metals Focus expects the ratio to have room to rise, citing restored London liquidity — about 932 million ounces total, with roughly 267 million available, nearly double the October 2025 low — plus ETP outflows of about 60 million ounces year-to-date and managed-money longs at 17 million ounces, the lowest since February 2024. A decisive break above 80 would confirm that gold's bid is defensive; a break below 75 would confirm it is monetary.
The two supporting signals
Natural gas rose 3.45% to $2.998 as heating demand entered its seasonal window, but the move is small enough to be weather rather than regime. It matters only if it persists into December, when the storage draw becomes the price setter.
Copper is the more useful signal. It fell 3.72% to $6.218 and is holding below the September support at $6.30. Copper is the cleanest read on Chinese industrial demand, and it is not participating in gold's bid — which is the point. If the late-cycle scenario is right, copper should lead the next leg lower. If it stabilises above $6.30 while gold holds above $4,000, the demand scare was overpriced and the gold bid is monetary, not defensive.
What two flips would mean
If gold closes above $4,197–4,202 and Brent holds below $100 through next week, the two moves stop being separate stories. That combination — higher gold, lower oil, softer copper — is the classic late-cycle signature: the market pricing slower growth and a slower Fed at the same time.
In that scenario, the assets most exposed are industrial commodities with a China demand link. Copper at $6.218, already below September support, is the first to feel it; iron ore is the second. Gold miners would be the relative winner, because their cost base falls with energy while their revenue rises with gold.
If only one flips — gold higher but Brent back above $104.77, or oil lower but gold back below $4,000 — the moves are positioning, not regime, and the ranges from October reassert.
Next week's commodity calendar
| Date | Event | Asset | What matters |
|---|---|---|---|
| Nov 10 | US October CPI | Gold, silver | Core +0.2% confirms the "last hike" bid |
| Nov 11 | EIA weekly inventories | WTI, Brent | A second draw supports the backwardation case |
| Nov 12–13 | OPEC, IEA and EIA monthly reports | Crude | 2027 demand revisions vs 2026 supply discipline |
| Nov 13 | US October PPI | Gold | Pipeline inflation vs consumer cooling |
Scenario one — the late-cycle signature. Gold closes above $4,202, Brent stays below $100 and copper fails to reclaim $6.30. The market is then pricing slower growth and a slower Fed at the same time. Copper is the short, and gold miners are the relative winner, because their cost base falls with energy while their revenue rises with gold.
Scenario two — a positioning flush. Gold fails at $4,202 and Brent reclaims $104.77 inside the same week. The two moves were never a regime change: the October ranges return, the gold-silver ratio drifts back toward 80, and the next directional signal waits for the December FOMC.
Read more
* The content presented above, whether from a third party or not, is considered as general advice only. This article should not be construed as containing investment advice, investment recommendations, an offer of or solicitation for any transactions in financial instruments.


