CFDs sind komplexe Instrumente und bergen aufgrund der Hebelwirkung ein hohes Risiko, schnell Geld zu verlieren. Sie sollten überlegen, ob Sie verstehen, wie CFDs funktionieren, und ob Sie es sich leisten können, das hohe Risiko einzugehen, Ihr Geld zu verlieren.
    Mitrade Insights widmet sich der Bereitstellung reichhaltiger, zeitnaher und wertvollster Finanzinformationen für Investoren, um ihnen zu helfen, die Marktsituation zu verstehen und zeitnahe Handelsmöglichkeiten zu finden.
    2021
    Bester Anbieter von Nachrichten & Analysen
    FxDailyInfo
    2022
    Beste globale Bildungsressourcen für Forex
    Internationales Wirtschaftsmagazin

    Silver Price Analysis: XAG/USD dips amid strong US Dollar, warmer inflation

    Quelle: Fxstreet
    26. Apr. 2024 17:44
    • Silver falls pulling back from a daily high of $27.73.
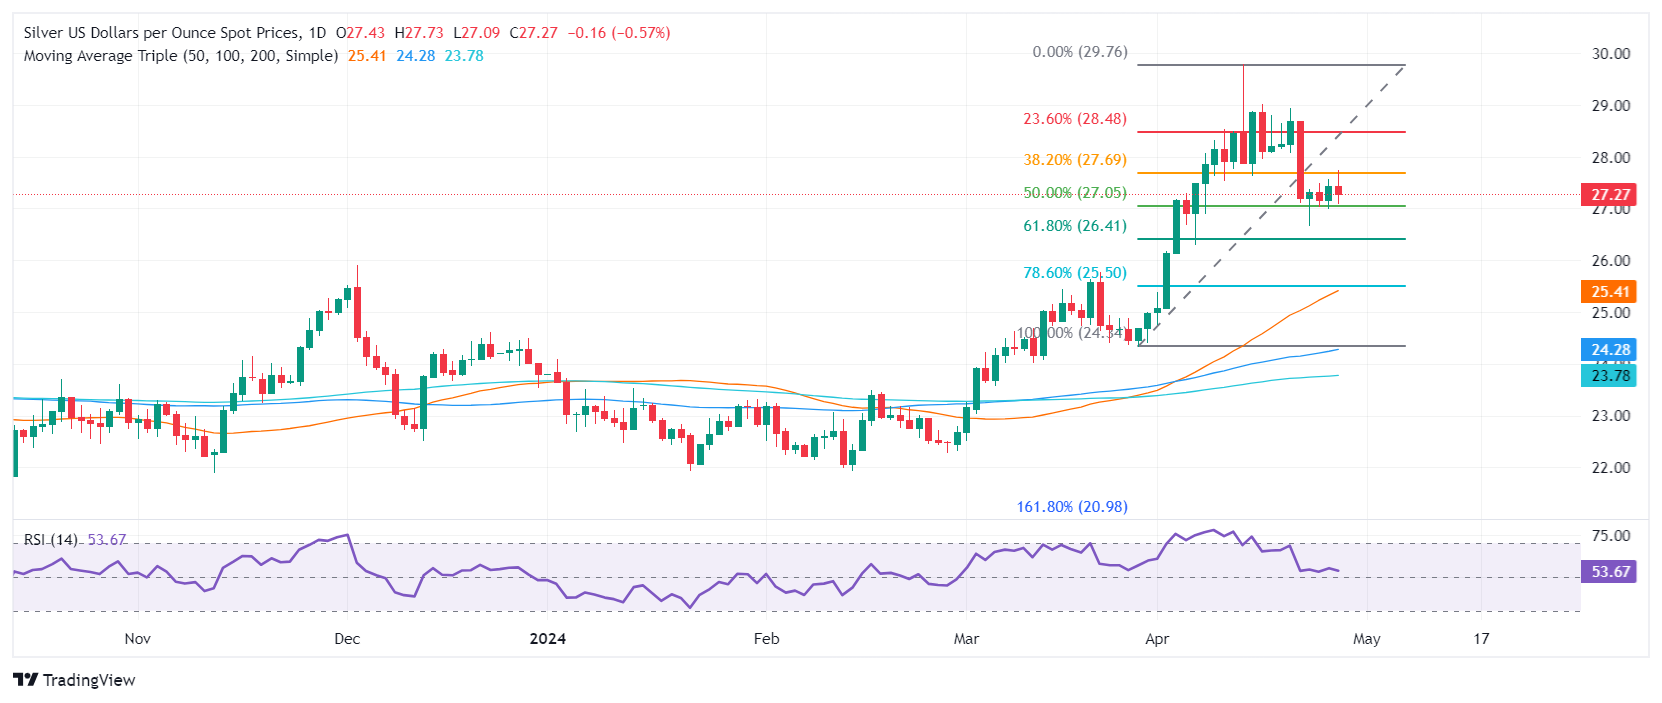
    • Technical analysis indicates the uptrend is intact with key support at the $27.05 level, marked by the 50% Fibonacci retracement.
    • If silver surpasses the $28.00 resistance, potential targets are $28.48 and possibly year highs near $29.76.
    • Conversely, breaking below $27.05 could lead to $26.41 and further declines.

    Silver's price dropped 0.79% after hitting a daily high of $27.73, as another inflation report in the United States showed warmer-than-expected inflation. The grey metal failed to capitalize on the fall in US Treasury yields, courtesy of a stronger US Dollar. At the time of writing, the XAG/USD trades at $27.21.

    XAG/USD Price Analysis: Technical outlook

    Despite retracing, the XAG/USD uptrend is intact, with dips viewed as opportunities for buyers to keep Silver's bid. During the last four trading days, Silver sellers had remained unable to push prices below the 50% Fibonacci retracement at $27.05, of the Fib drawn from the swing low at $24.34 to the latest high at $29.76.

    For a bullish resumption, once traders surpass the $28.00 figure, that would pave the way for further upside. The first resistance would be the 23.6% Fib retracement at $28.48, followed by the $29.00 mark. The next supply area would be the year-to-date (YTD) high at $29.76.

    On the flip side, bears could find some relief if XAG/USD slides below the 50% Fib retracement at $27.05, followed by the 61.8% retracement at $26.41. A subsequent dip is seen below that level, exposing the confluence of the 50-day moving average (DMA) and the 78.6% Fib retracement at $25.50.

    XAG/USD Price Action – Daily Chart
    XAG/USD

    Overview
    Today last price 27.24
    Today Daily Change -0.19
    Today Daily Change % -0.69
    Today daily open 27.43
     
    Trends
    Daily SMA20 27.46
    Daily SMA50 25.33
    Daily SMA100 24.24
    Daily SMA200 23.76
     
    Levels
    Previous Daily High 27.58
    Previous Daily Low 26.98
    Previous Weekly High 29.02
    Previous Weekly Low 27.62
    Previous Monthly High 25.77
    Previous Monthly Low 22.51
    Daily Fibonacci 38.2% 27.35
    Daily Fibonacci 61.8% 27.21
    Daily Pivot Point S1 27.08
    Daily Pivot Point S2 26.74
    Daily Pivot Point S3 26.49
    Daily Pivot Point R1 27.67
    Daily Pivot Point R2 27.92
    Daily Pivot Point R3 28.27


    Haftungsausschluss: Nur zu Informationszwecken. Die bisherige Performance ist kein verlässlicher Indikator für zukünftige Ergebnisse.
    placeholder
    India Gold price today: Gold falls, according to MCX dataGold prices fell in India on Thursday, according to data from India's Multi Commodity Exchange (MCX).
    Quelle:  Fxstreet
    Gold prices fell in India on Thursday, according to data from India's Multi Commodity Exchange (MCX).
    placeholder
    WTI drops to seven-week lows below $80.00 on surprise build crude inventoriesWestern Texas Intermediate (WTI), the US crude oil benchmark, is trading around $79.20 on Thursday.
    Quelle:  Fxstreet
    Western Texas Intermediate (WTI), the US crude oil benchmark, is trading around $79.20 on Thursday.
    placeholder
    Natural Gas edges up back above $2 despite bearish fundamentalsNatural Gas (XNG/USD) prices are ticking up above $2 on Monday, showing a distorted picture of fundamentals against correlations. Fundamentally, Gas prices are expected to retreat a little
    Quelle:  Fxstreet
    Natural Gas (XNG/USD) prices are ticking up above $2 on Monday, showing a distorted picture of fundamentals against correlations. Fundamentally, Gas prices are expected to retreat a little
    verbundene Finanzinstrumente
    goTop
    quote