




ASX 200 Forecast 2026: What the Rate Cycle, China and Wall Street Mean for Australian Stocks
The ASX 200 surged 120 points to hit 8,844 on July 4, 2026 - its highest level in over a week as Wall Street delivered a strong lead, Middle East tensions showed early signs of easing, and gold miners jumped 7.9% on softer US payroll data. Two days later the index was back at 8,825 and sliding as job ads data disappointed, RBA minutes flagged ongoing inflation risk, and traders turned cautious ahead of China CPI and PPI readings.
That two-day whipsaw tells you everything about the ASX 200 in 2026. The index is being pulled in three directions simultaneously by the most hawkish RBA in over a decade, a Chinese economy that cannot decide whether it is recovering or stalling, and a Wall Street that sets the overnight tone for every Australian session whether you follow US stocks or not.
This guide covers where the index stands today, what each of those three forces means for the second half of 2026, which sectors are leading and lagging, and how traders are positioning around the benchmark from both sides of the trade. It also covers the three forecast scenarios analysts are working with and the specific instruments most directly linked to the ASX 200's direction right now.
Where the ASX 200 Stands Right Now
The ASX 200 is Australia's benchmark equity index tracking the 200 largest companies on the Australian Securities Exchange by market capitalization, and it is the single most reliable gauge of domestic investor sentiment and economic confidence.
The index delivered a third consecutive year of gains through 2025, with the accumulated index rising 8.73% over the calendar year including dividends reinvested. The 2026 financial year was more difficult. Three consecutive RBA rate hikes beginning in February, ongoing above-target inflation, the Middle East conflict and its effects on energy costs, federal budget changes affecting property taxation, and uneven commodity prices all weighed on the index at various points.
As of early July 2026, the ASX 200 trades around 8,820 to 8,850, hovering near recent highs but unable to break decisively above them. Analysts at IG project the index moving toward the 9,300 to 9,500 area by year end 2026 where it would encounter multi-year trend channel resistance.
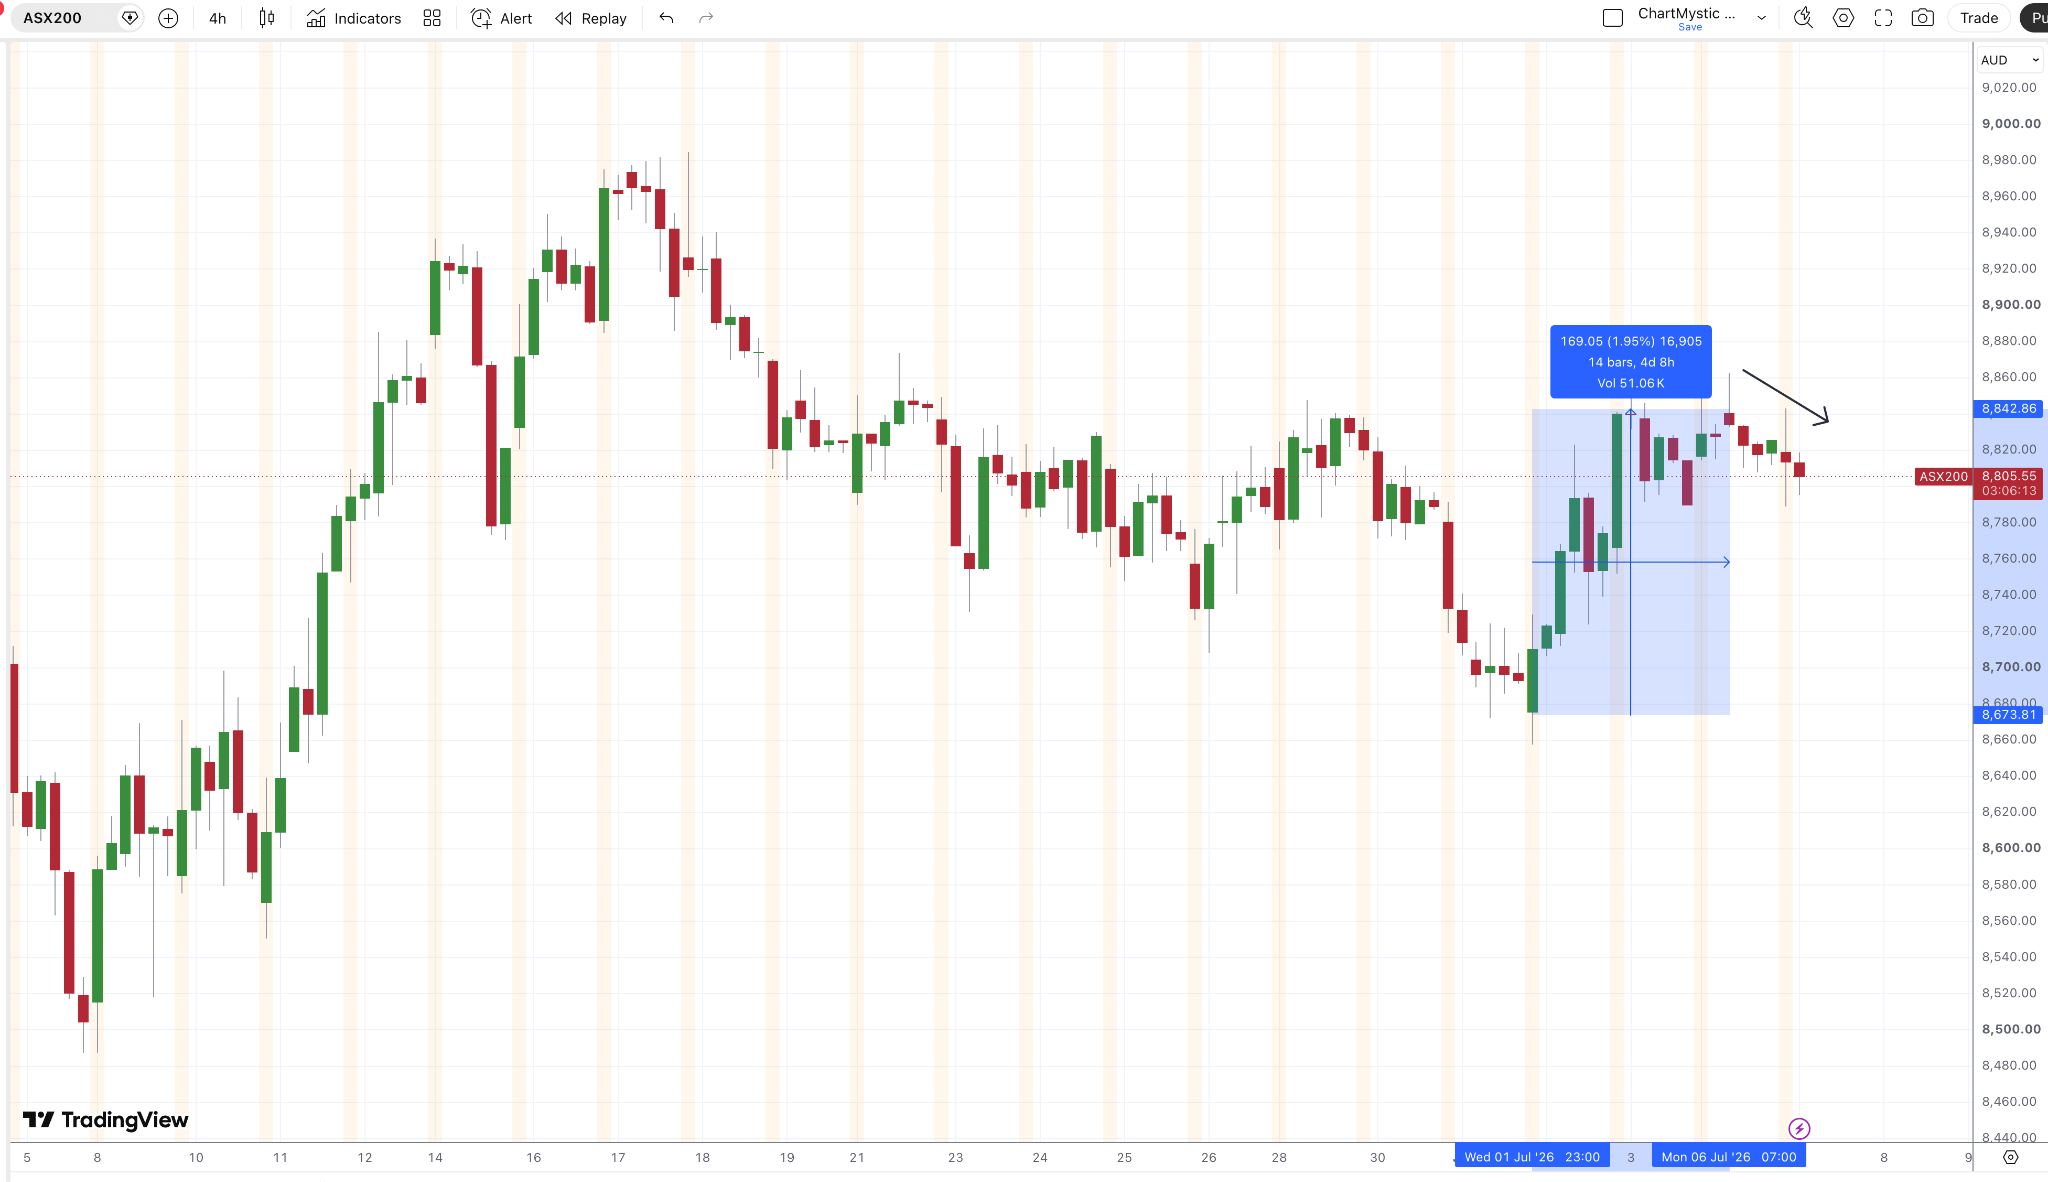
Source: ASX 200 TradingView 4H Chart - shows the 2026 trading range, the July 4 surge to 8,842, and the July 6 pullback to 8,805 as job ads disappointed and RBA minutes maintained hawkish pressure.
“Trade ASX 200 with an ASIC-regulated broker. Fast AUD funding via PayID. ”
The RBA Rate Cycle: The Biggest Domestic Driver
Three consecutive rate hikes in February, March, and May 2026 brought the RBA cash rate to 4.35%, its highest level since 2012, and the June minutes made clear the board has not closed the door on further tightening.
Governor Michele Bullock has stated that every meeting is live for rate decisions, with markets pricing the possibility of the cash rate reaching 4.60% by year end. The board flagged two primary risks in its June minutes: the ongoing Middle East conflict and what the RBA described as persistently weak productivity growth in the domestic economy. For the ASX 200, higher rates create a split outcome.
Financial services and basic materials dominate the index, making banks and miners the two main swing factors in either direction. Banks face rising funding pressure and slower mortgage demand simultaneously, with the big four shedding between 0.1% and 1.1% on July 7 as that tension played out in their share prices. The Australian two-year government bond yield slipped to 4.43% on the last day of the financial year, its lowest level since March, the first credible signal that markets are beginning to price the rate cycle approaching its peak even as the RBA maintains hawkish language in its communications.
The China Factor: Iron Ore, Gold and the Materials Sector
China reduced its GDP growth target to between 4.5% and 5% for 2026, the lowest target since 1991, and the implications flow directly into the ASX 200 through the materials sector which accounts for a substantial portion of index market capitalisation.
Iron ore has been trading around $106.40 per tonne, holding above key support levels on Chinese stimulus hopes but struggling to break higher as construction activity and industrial output remain uneven. On July 6, BHP Group (BHP.AX) fell 0.7% to $59.40, Fortescue (FMG.AX) declined 1.9% to $19.15, and Rio Tinto (RIO.AX) dropped 0.9% to $172.51 as a stronger US dollar and early signs of Strait of Hormuz reopening removed some of the commodity supply premium that had been supporting prices.
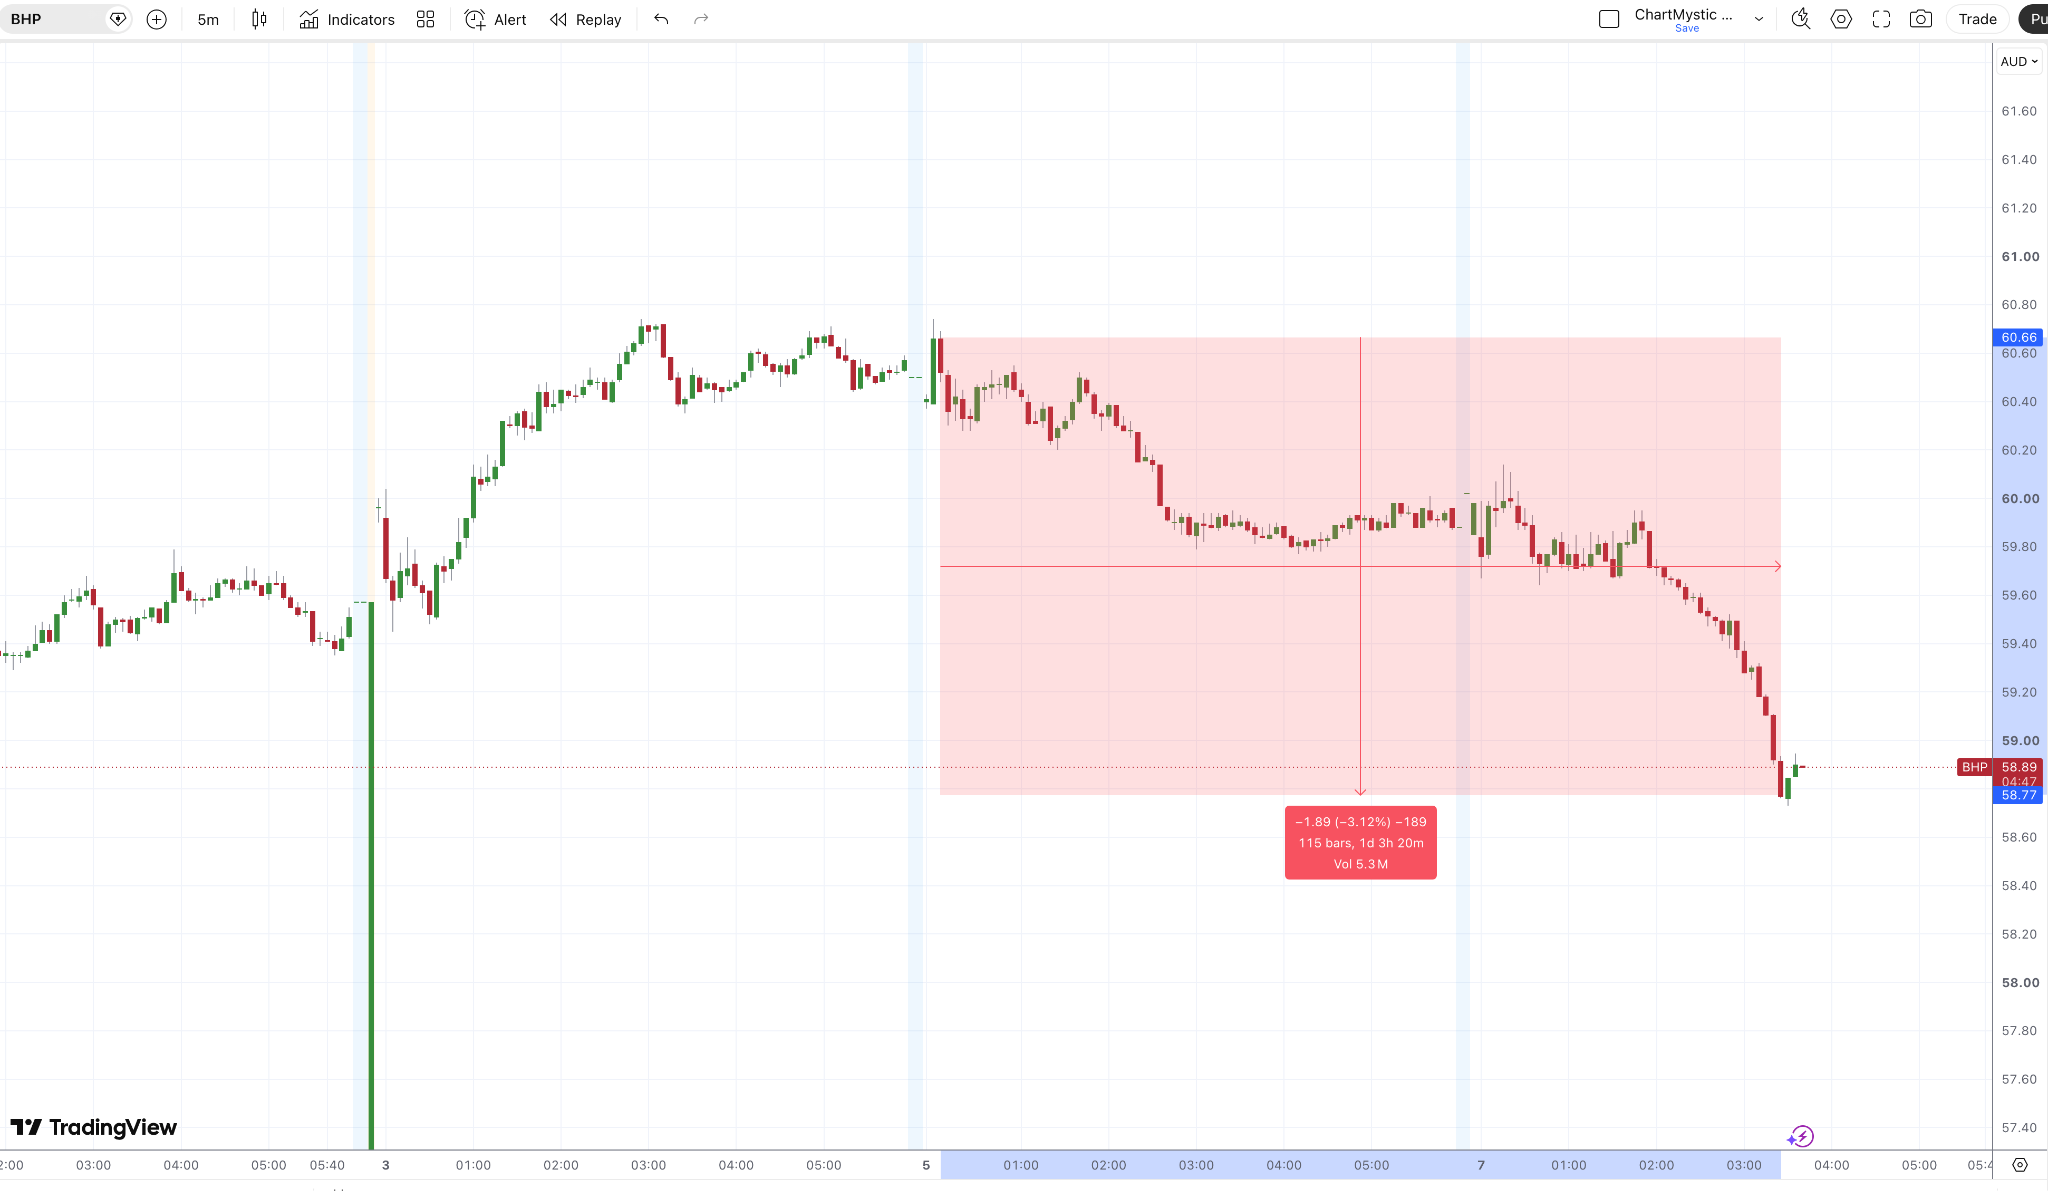
Source: BHP.AX TradingView 5M Chart - shows BHP's 2026 price action, the July 4 materials sector rally, and the July 6 pullback to $58.77.
The materials sector gives the ASX 200 its built-in commodity buffer. When domestic rate pressure hurts banks, property, and consumer stocks, miners can still attract capital if commodity prices hold. The reverse is equally true: if commodities roll over while banks remain under pressure, the index loses both support pillars simultaneously and a deeper correction becomes the more likely outcome.
Gold has been a standout. Gold stocks jumped 7.9% on July 4 as bullion rallied on softer US payroll data, with Northern Star (NST.AX) jumping 10.6% and Evolution Mining (EVN.AX) up 8.6%. Gold-related ASX stocks roughly doubled in 2025 in a rare alignment of central bank buying, geopolitical risk premium, and real yield compression. While a repeat of that magnitude is unlikely, the sector remains highly sensitive to shifts in US dollar strength and Federal Reserve rate expectations under the Warsh-led Fed.
“Trade ASX 200 with an ASIC-regulated broker. Fast AUD funding via PayID. ”
What Wall Street Does to the ASX Overnight
The ASX 200 lacks the concentration of semiconductor and large-cap technology companies that generated the most dramatic global gains in the AI investment cycle, leaving the benchmark dependent on Wall Street's overnight close as its primary external signal for each session.
When the Dow Jones (DJIA) hit record highs in the week ending July 4, the ASX surged 120 points to 8,844 in direct response. When Wall Street delivered a mixed lead the following Thursday, the ASX traded cautiously despite positive futures. The correlation is consistent enough that traders who ignore the overnight US close before opening Australian equity positions are effectively trading blind to the most reliable short-term directional signal available. The AI trade has added a secondary Wall Street linkage through ASX technology-adjacent names including NextDC (NXT.AX) and Goodman Group (GMG.AX), which now move on Nvidia earnings and hyperscaler capital expenditure announcements in ways that have no historical precedent for locally listed stocks.
ASX 200 Forecast 2026: Three Scenarios
The bull case requires a genuine easing of Middle East tensions that brings oil back toward $75 to $80, Chinese data confirming the composite leading indicator is trending back above 99, and RBA language at its August meeting that clearly signals the rate cycle has peaked. In this scenario the index has a clear path toward the 9,300 to 9,500 analyst target range by year end. The partial Strait of Hormuz reopening and the softer July 4 US payroll data are the two most recent signals pointing in this direction.
The base case keeps the ASX 200 oscillating between 8,600 and 9,000 through the July to September quarter as the RBA maintains its hawkish posture, China data remains mixed, and Wall Street provides the primary directional signal session by session. This is the most likely outcome if the macro picture stays broadly unchanged from where it sits in early July 2026.
The bear case is a further RBA rate hike in August or September on the back of a June CPI print above expectations, a Chinese GDP miss that sends iron ore below $100 per tonne, and a Wall Street selloff driven by the Fed signalling a 2027 rate hike under Kevin Warsh. A break below the 8,383 low set in late November 2025 would signal a correction deeper than anything seen since April 2025 and bring the 7,800 long-term support level into scope for the first time in over a year.
How Traders Position Around the ASX 200 on Mitrade
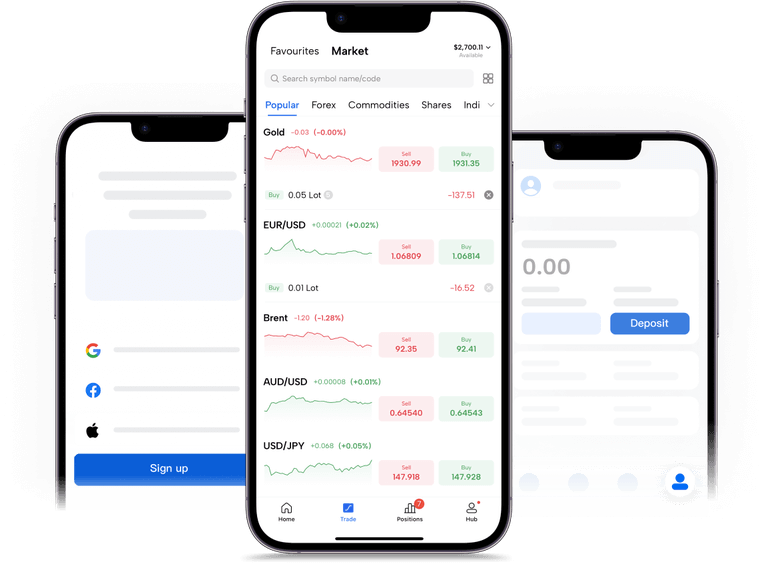
Mitrade, regulated by ASIC under licence AFSL 398528, offers the ASX 200 as an index CFD instrument, which means traders can go long if they expect the index to push toward the 9,300 analyst target or short if they expect the rate cycle and China uncertainty to extend the range. Zero commission applies and stop-loss controls appear directly on the order screen before any trade is confirmed.
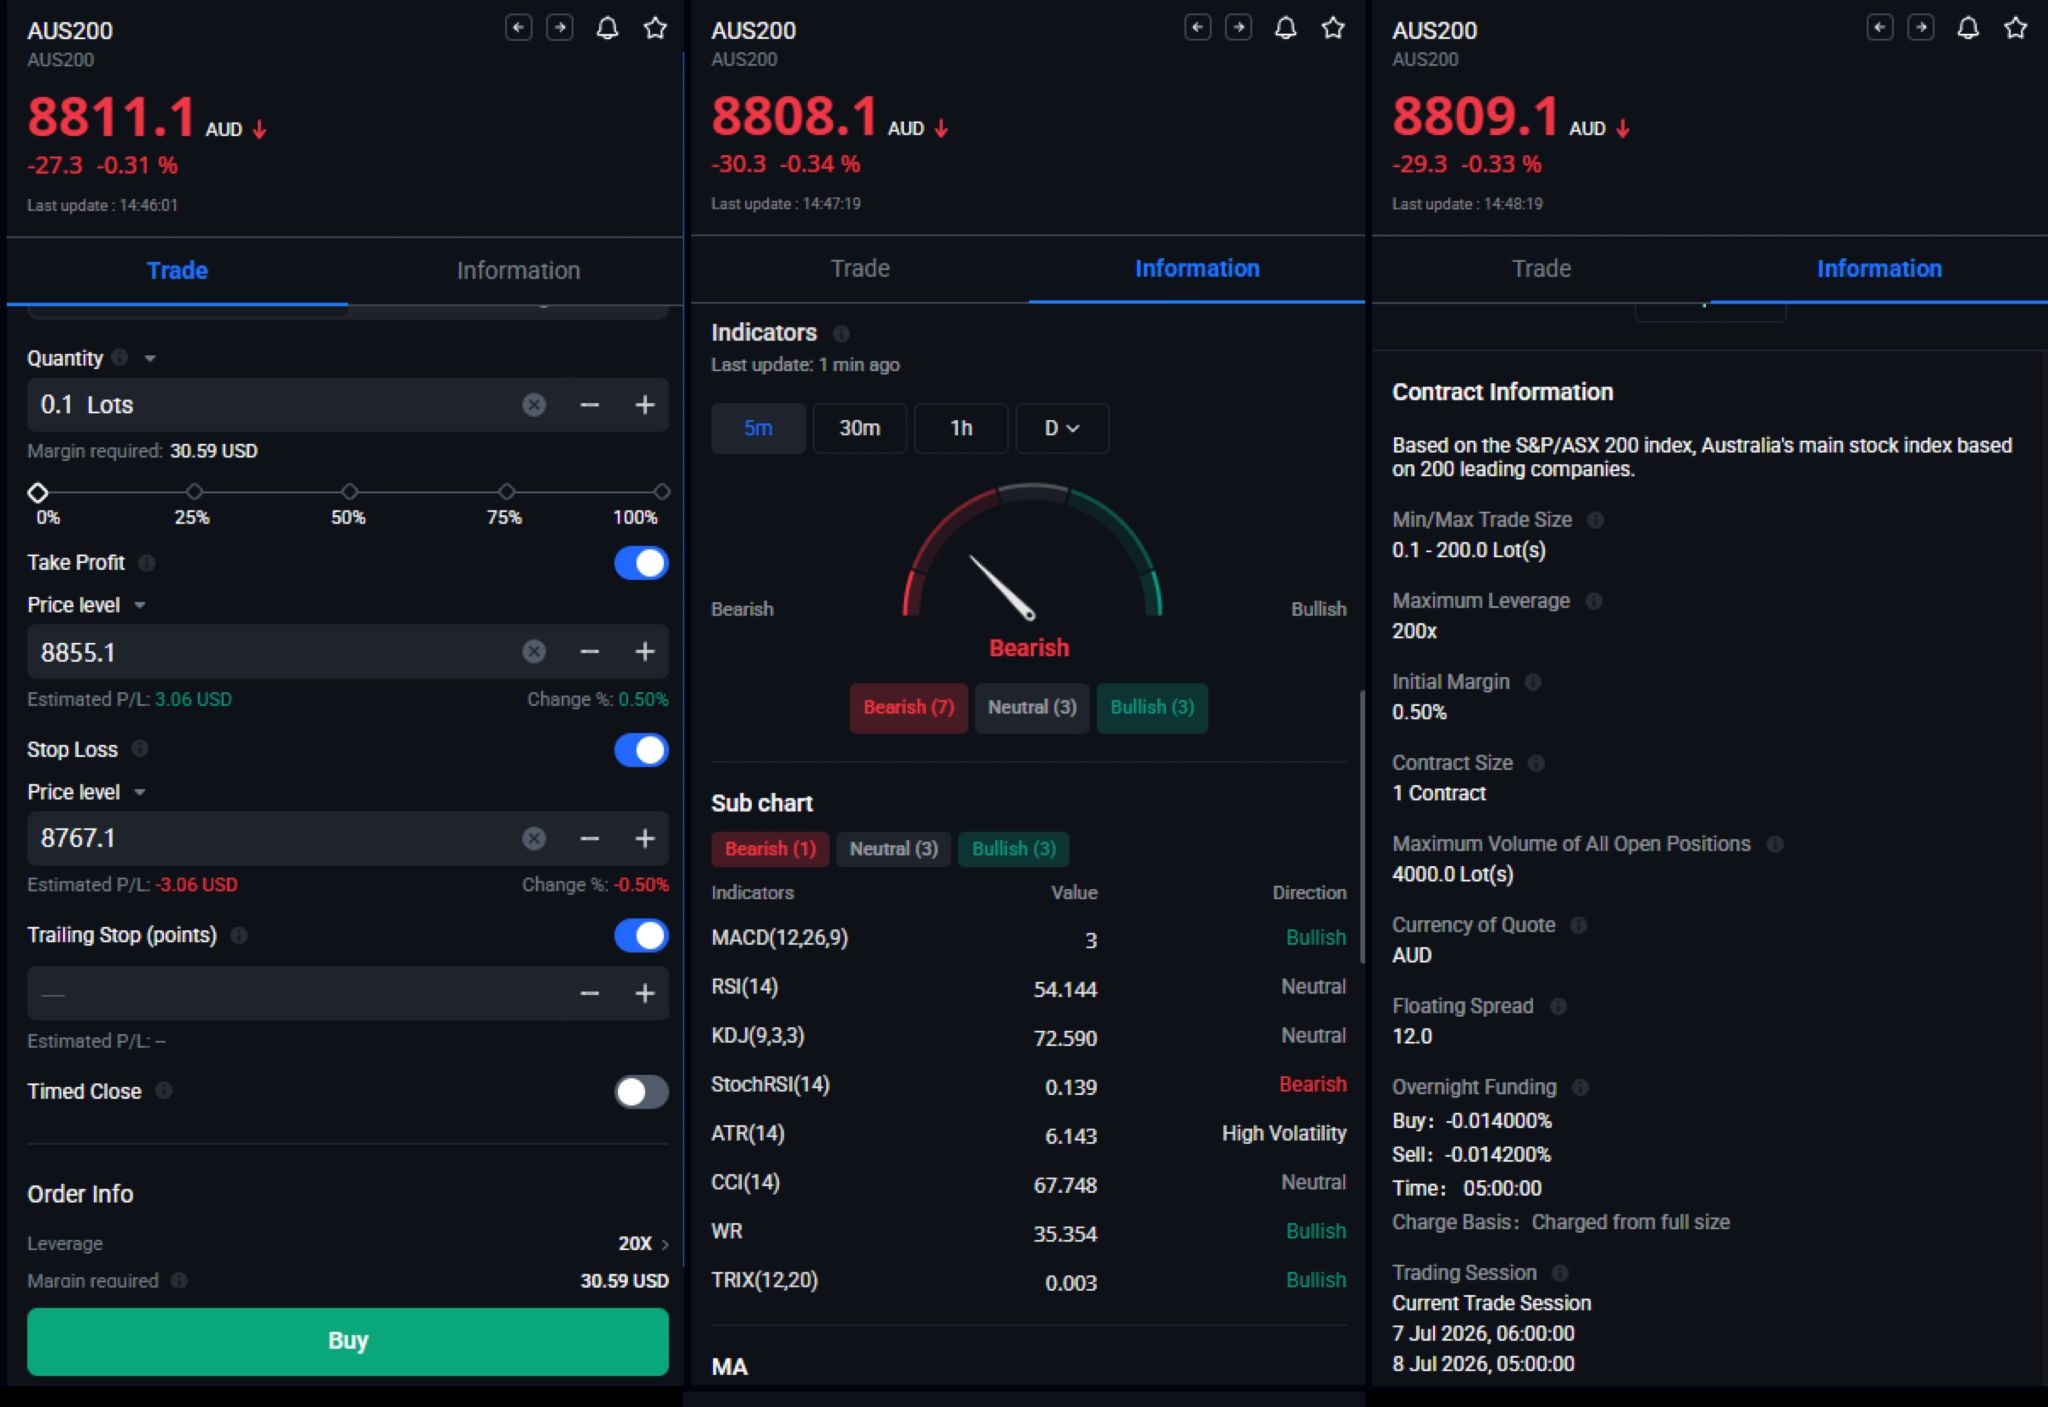
Source: Trading ASX200 on Mitrade
Traders watching the sector rotation within the index can also access commodity and currency instruments directly linked to its direction. Iron ore is available as a CFD for direct exposure to the China demand story driving BHP, Rio, and Fortescue. Gold (XAU/USD) captures the safe haven premium that has made the ASX gold sector its strongest recent performer. AUD/USD moves with ASX sentiment, RBA rate expectations, and Chinese data simultaneously, making it one of the most direct single instruments for expressing a view on the Australian macro picture. The economic calendar built into the Mitrade platform flags RBA meeting dates, Chinese PMI and CPI releases, and Australian employment data in AEST so traders never miss the scheduled events that move the index most sharply.
Disclaimer: CFD trading involves significant risk of loss. Past performance does not guarantee future results. This article serves informational purposes only and does not constitute financial advice. Consider your risk tolerance before trading.


1. What is the ASX 200 and what drives it?
The ASX 200 tracks the 200 largest companies on the Australian Securities Exchange by market capitalisation. Financial services and basic materials dominate the index, making banks and miners the two primary swing factors. RBA interest rate decisions, Chinese economic data affecting iron ore and copper prices, and the overnight Wall Street performance are the three most consistent drivers of daily direction.
2. What is the ASX 200 forecast for year end 2026?
Analysts at IG project the ASX 200 moving toward the 9,300 to 9,500 area by year end 2026. The bull case requires easing Middle East tensions, stable Chinese data, and a peak in the RBA rate cycle. The base case keeps the index oscillating between 8,600 and 9,000 through the July to September quarter. The bear case involves a further RBA hike and a Chinese data miss that removes the commodity support holding the index above its April lows.
3. How does the RBA rate cycle affect the ASX 200?
Higher rates create a split outcome for the ASX 200. Banks face rising funding pressure and slower mortgage demand that weighs on earnings, while miners are less directly affected by domestic rate policy and can attract capital if commodity prices hold. Rate hikes also strengthen the Australian dollar, which reduces the AUD-translated revenue of companies with global operations and makes Australian exports more expensive for trading partners.
4. Why does Wall Street affect the ASX 200?
The ASX 200 takes its primary directional signal from Wall Street's overnight close because global institutional investors allocate across markets simultaneously and risk appetite set in New York flows into Sydney within hours. The ASX lacks the concentration of large-cap technology companies that generated independent momentum on other global exchanges in 2026, leaving it more dependent on the US overnight lead than indices like Japan's Nikkei or Korea's KOSPI.
5. What sectors are performing best on the ASX 200 in 2026?
Gold mining stocks have been the strongest performers in recent sessions, with the sector jumping 7.9% on July 4 on softer US payroll data. Materials more broadly have provided a commodity buffer against domestic rate pressure. Financial services face the most persistent structural headwind, with the big four banks under margin pressure from slowing mortgage demand and rising credit costs simultaneously.
6. Can Australian traders short the ASX 200?
Yes. Mitrade offers the ASX 200 as an index CFD under ASIC regulation with licence AFSL 398528. Traders can go short on the index when rate pressure, China uncertainty, or Wall Street weakness threatens to extend the current range or push the benchmark toward the 8,383 support level. Zero commission applies and a free demo account with $50,000 in virtual funds is available before going live.
Disclaimer: The content presented above, whether from a third party or not, is considered as general advice only. CFD trading involves significant risk of loss. Past performance does not guarantee future results. This article serves informational purposes only and does not constitute financial advice. Consider your risk tolerance before trading.


